analyze.splash
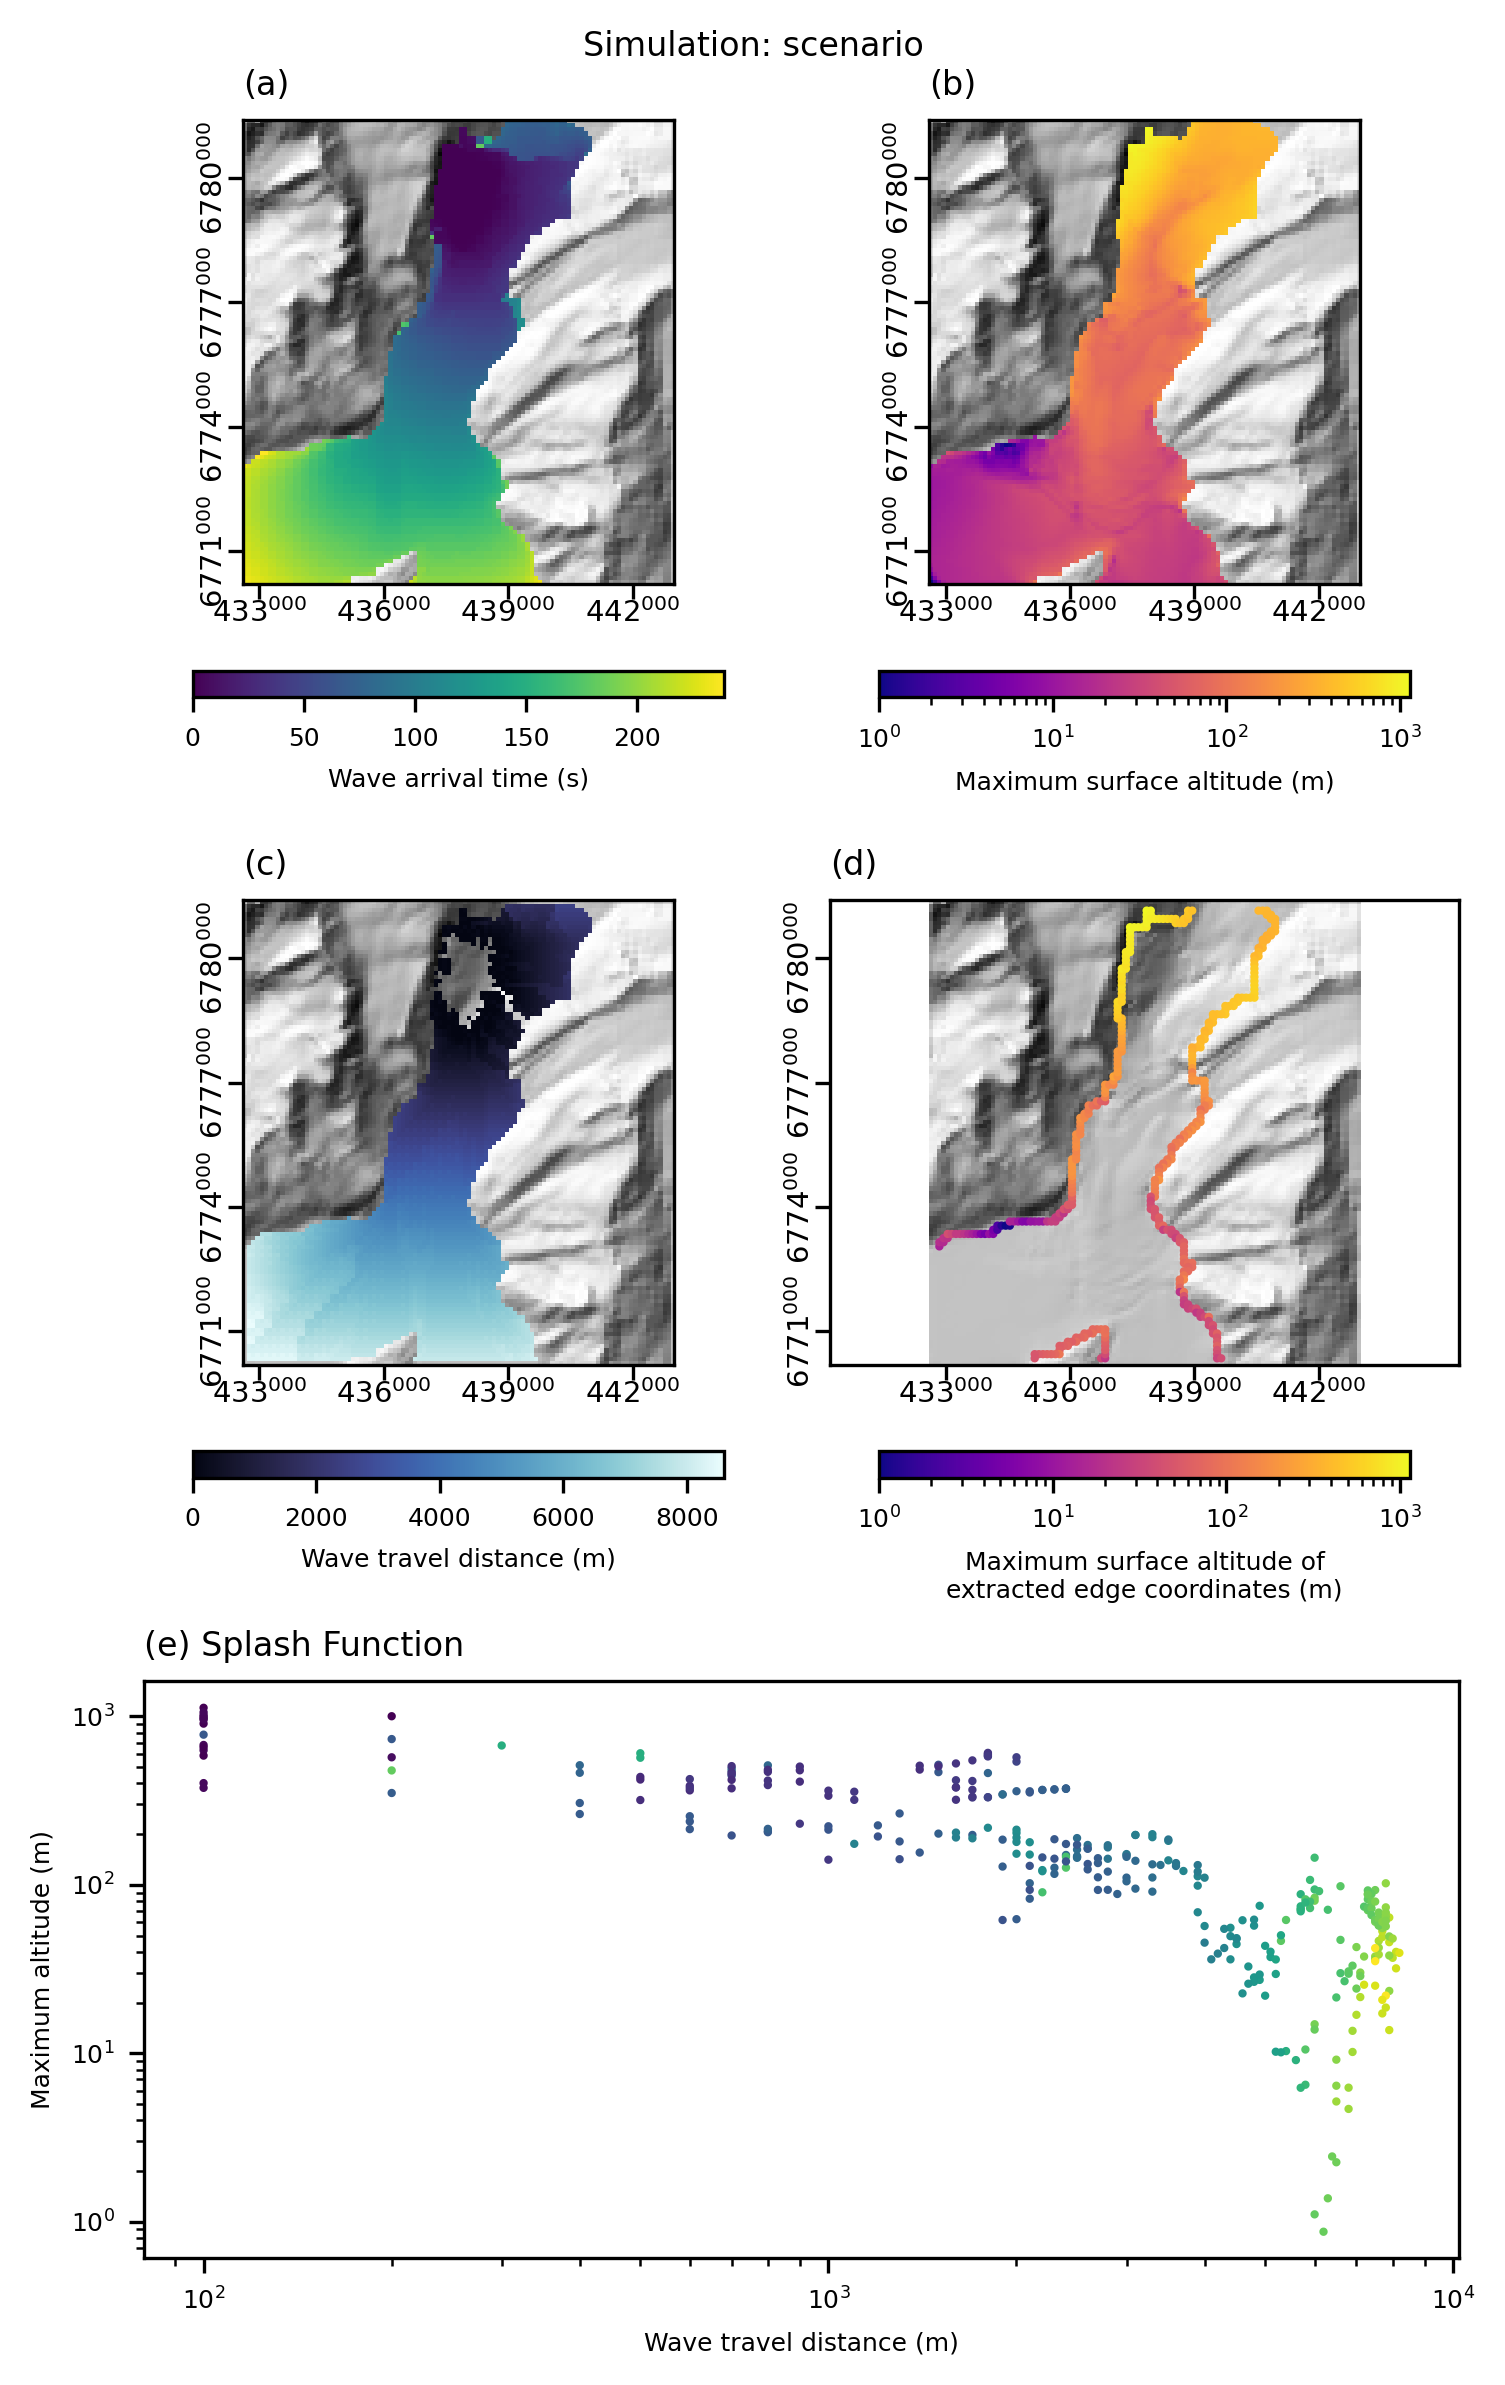
The function analyze.splash analyzes the relation among the wave travel distance, wave arrival time, and maximum tsunami elevation along the shoreline (or near it) across the simulation domain. This analysis is inspired by Oppikofer et al. (2019).
It is called using the following syntax:
# Splash function analysis
from digger import analyze

analyze.splash(
    data_path="_output/fgmax0001.txt",
)
Attention
This code snippet is not fully self-sufficient. This snippet relies on simulation output files. To reproduce the example, execute the file digger/examples/post-run/barry_arm/setpostprocess.py from within the directory in which it is located. Before the script is executed either the example simulation must be run or the file digger/data/barry_arm_output.zip must be unzipped and the resulting directory (_output) must be placed within digger/examples/post-run/barry_arm/.
Running this code snippet generates a diagnostic figure that visualizes the components of the splash function. It also generates a csv file containing the plotted information at the location of the edge coordinates.

Fig. 16 An example of the diagnostic output provided by digger.analyze.splash.
References
Oppikofer, T., Hermanns, R.L., Roberts, N.J., and Böhme, M., 2019, SPLASH: Semi-empirical prediction of landslide-generated displacement wave run-up heights: Geological Society, London, Special Publications, v. 477, no. 1, p. 353–366, https://doi.org/10.1144/SP477.1.