analyze.energetics
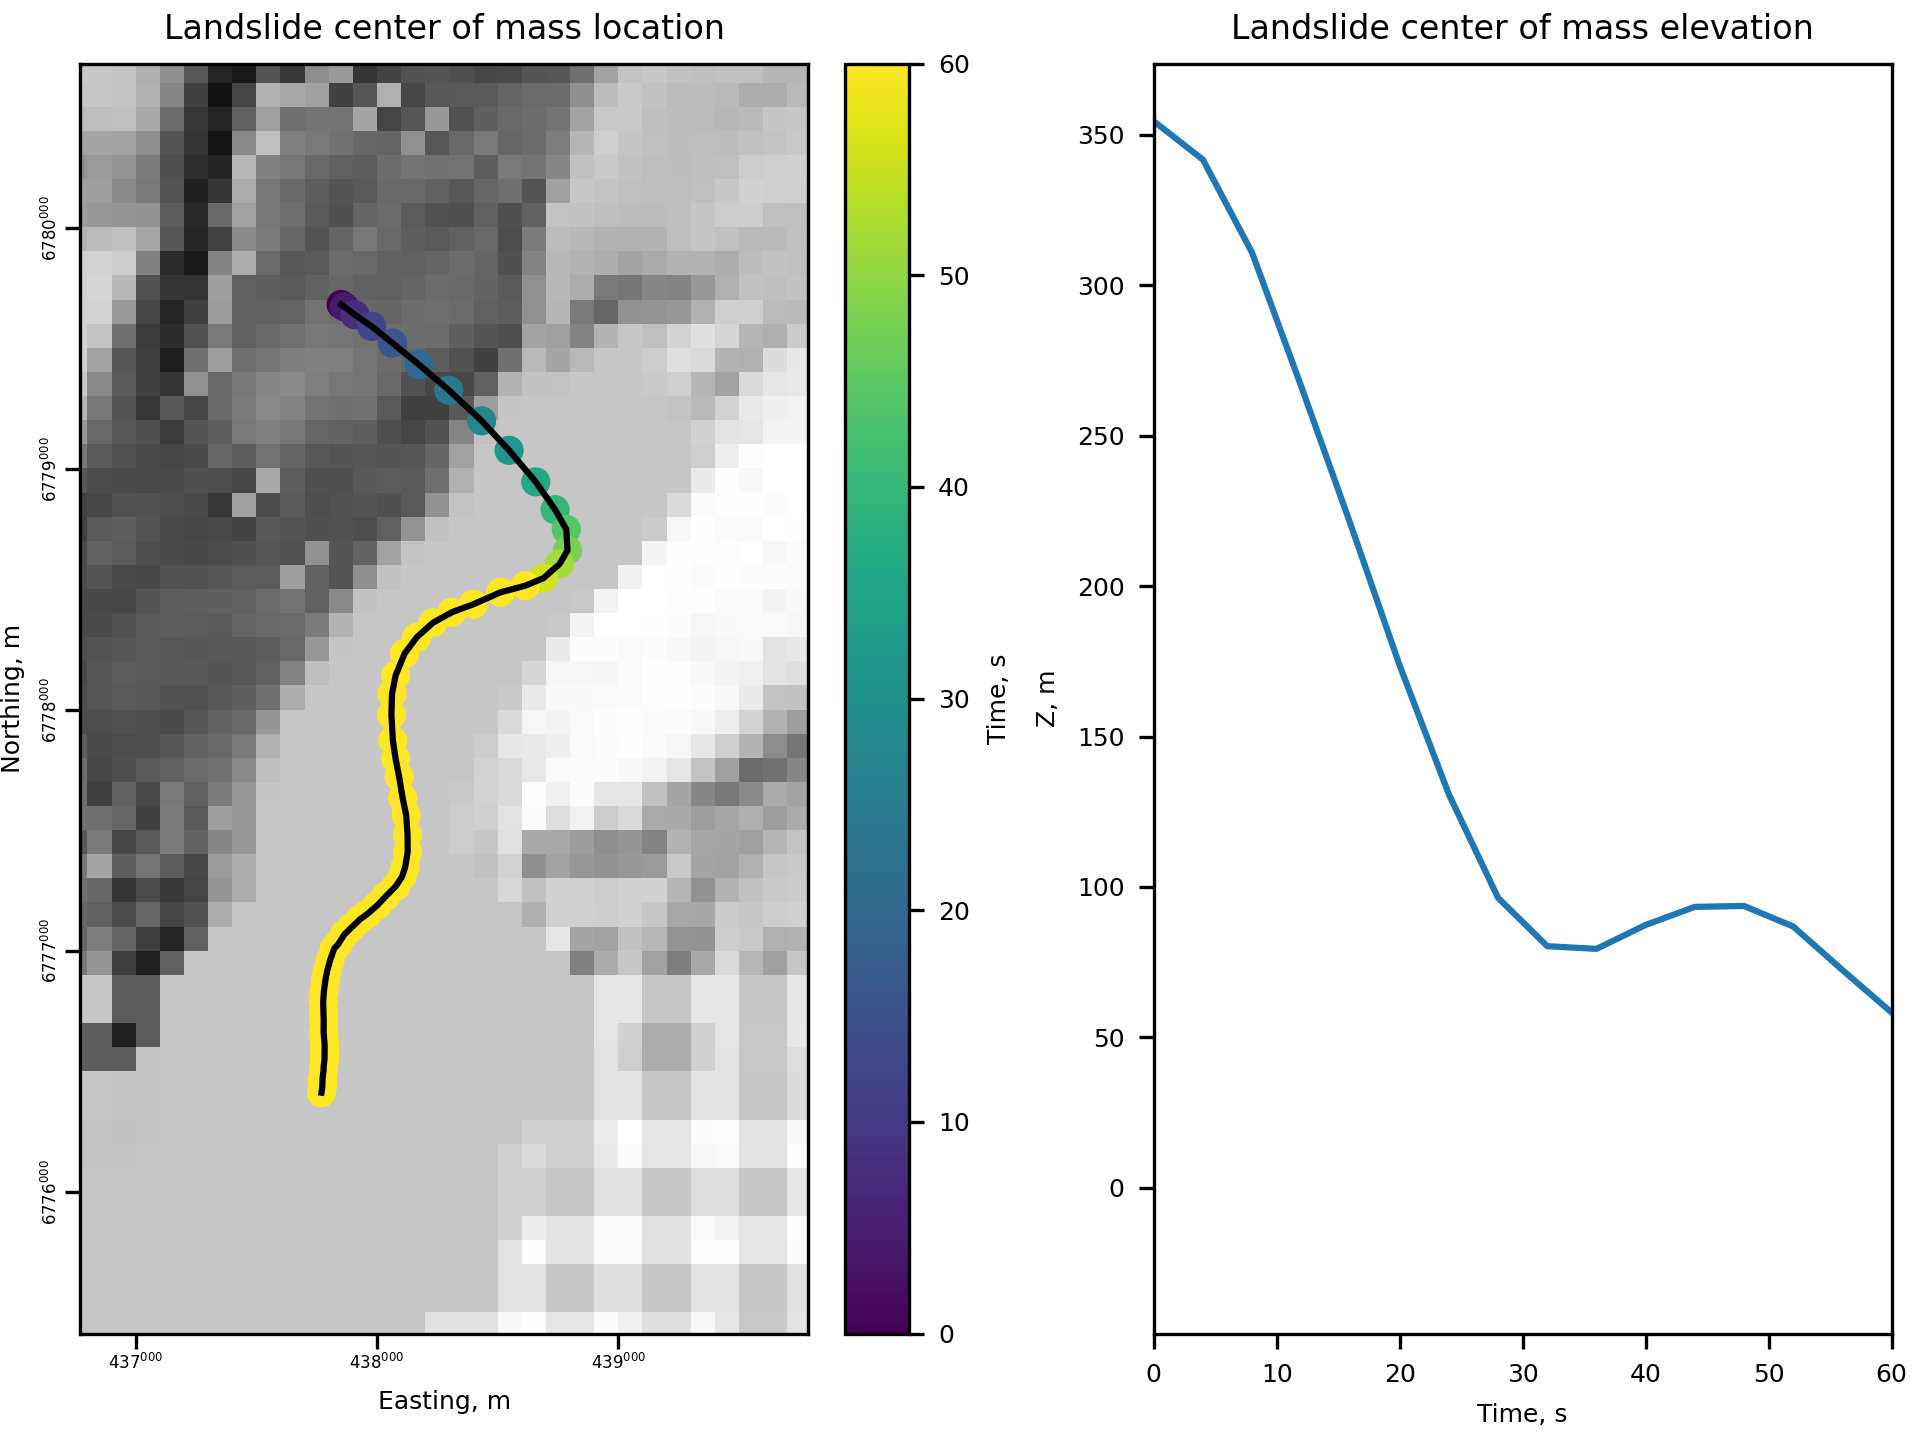
The function analyze.energetics analyzes the location and motion of landslide center of mass through the simulation duration. It also calculates the potential and kinetic energy of the landslide and the rest of the simulation domain. It is inspired in part by Iverson and George (2016).
It is called using the following syntax:
# Energetics analysis
from digger import analyze

# drytolerance, rho_f, and rho_s are required.
# these can be imported from the .data files.

# from clawpack.clawutil.data import ClawData
# import os
# tsudata = ClawData()
# tsudata.read(os.path.join('.', '_output', "geoclaw.data")
# dig_data = ClawData()
# dig_data.read(os.path.join('.' '_output', "setdclaw.data")

drytolerance = 0.001  # tsudata['drytolerance']
rho_f = 1000  # dig_data['rho_f']
rho_s = 2700  # dig_data['rho_s']

energetics_info = analyze.energetics(
    wdir=".",
    gdir="_output",
    rho_f=rho_f,
    rho_s=rho_s,
    drytolerance=drytolerance,
)
Attention
This code snippet is not fully self-sufficient. This snippet relies on simulation output files. To reproduce the example, execute the file digger/examples/post-run/barry_arm/setpostprocess.py from within the directory in which it is located. Before the script is executed either the example simulation must be run or the file digger/data/barry_arm_output.zip must be unzipped and the resulting directory (_output) must be placed within digger/examples/post-run/barry_arm/.
Running this code snippet generates a csv file that summarizes the energy components and center of mass location at each output timestep. It also generates a yaml file that synthesizes the results across the entire simulation duration. See the function API for a description of all csv columns and yaml entries.
PE0: 4742055994465005.0
KEmax: 1415084614693755.5
velmax: 43.275599872633485
initial_mass: 1238696258193.3594
initial_volume: 604006186.7427826
initial_density: 2050.8006134621096
initial_m: 0.6181180079400193
center_of_mass_fall_height: 378.48825976296655
center_of_mass_distance: 4243.215466823746
h_over_l: 0.08919845403143845
l_over_h: 11.210956634377823
KEmax_over_PE0: 0.2984116206863568
A_over_V_23: 25.358911144722683
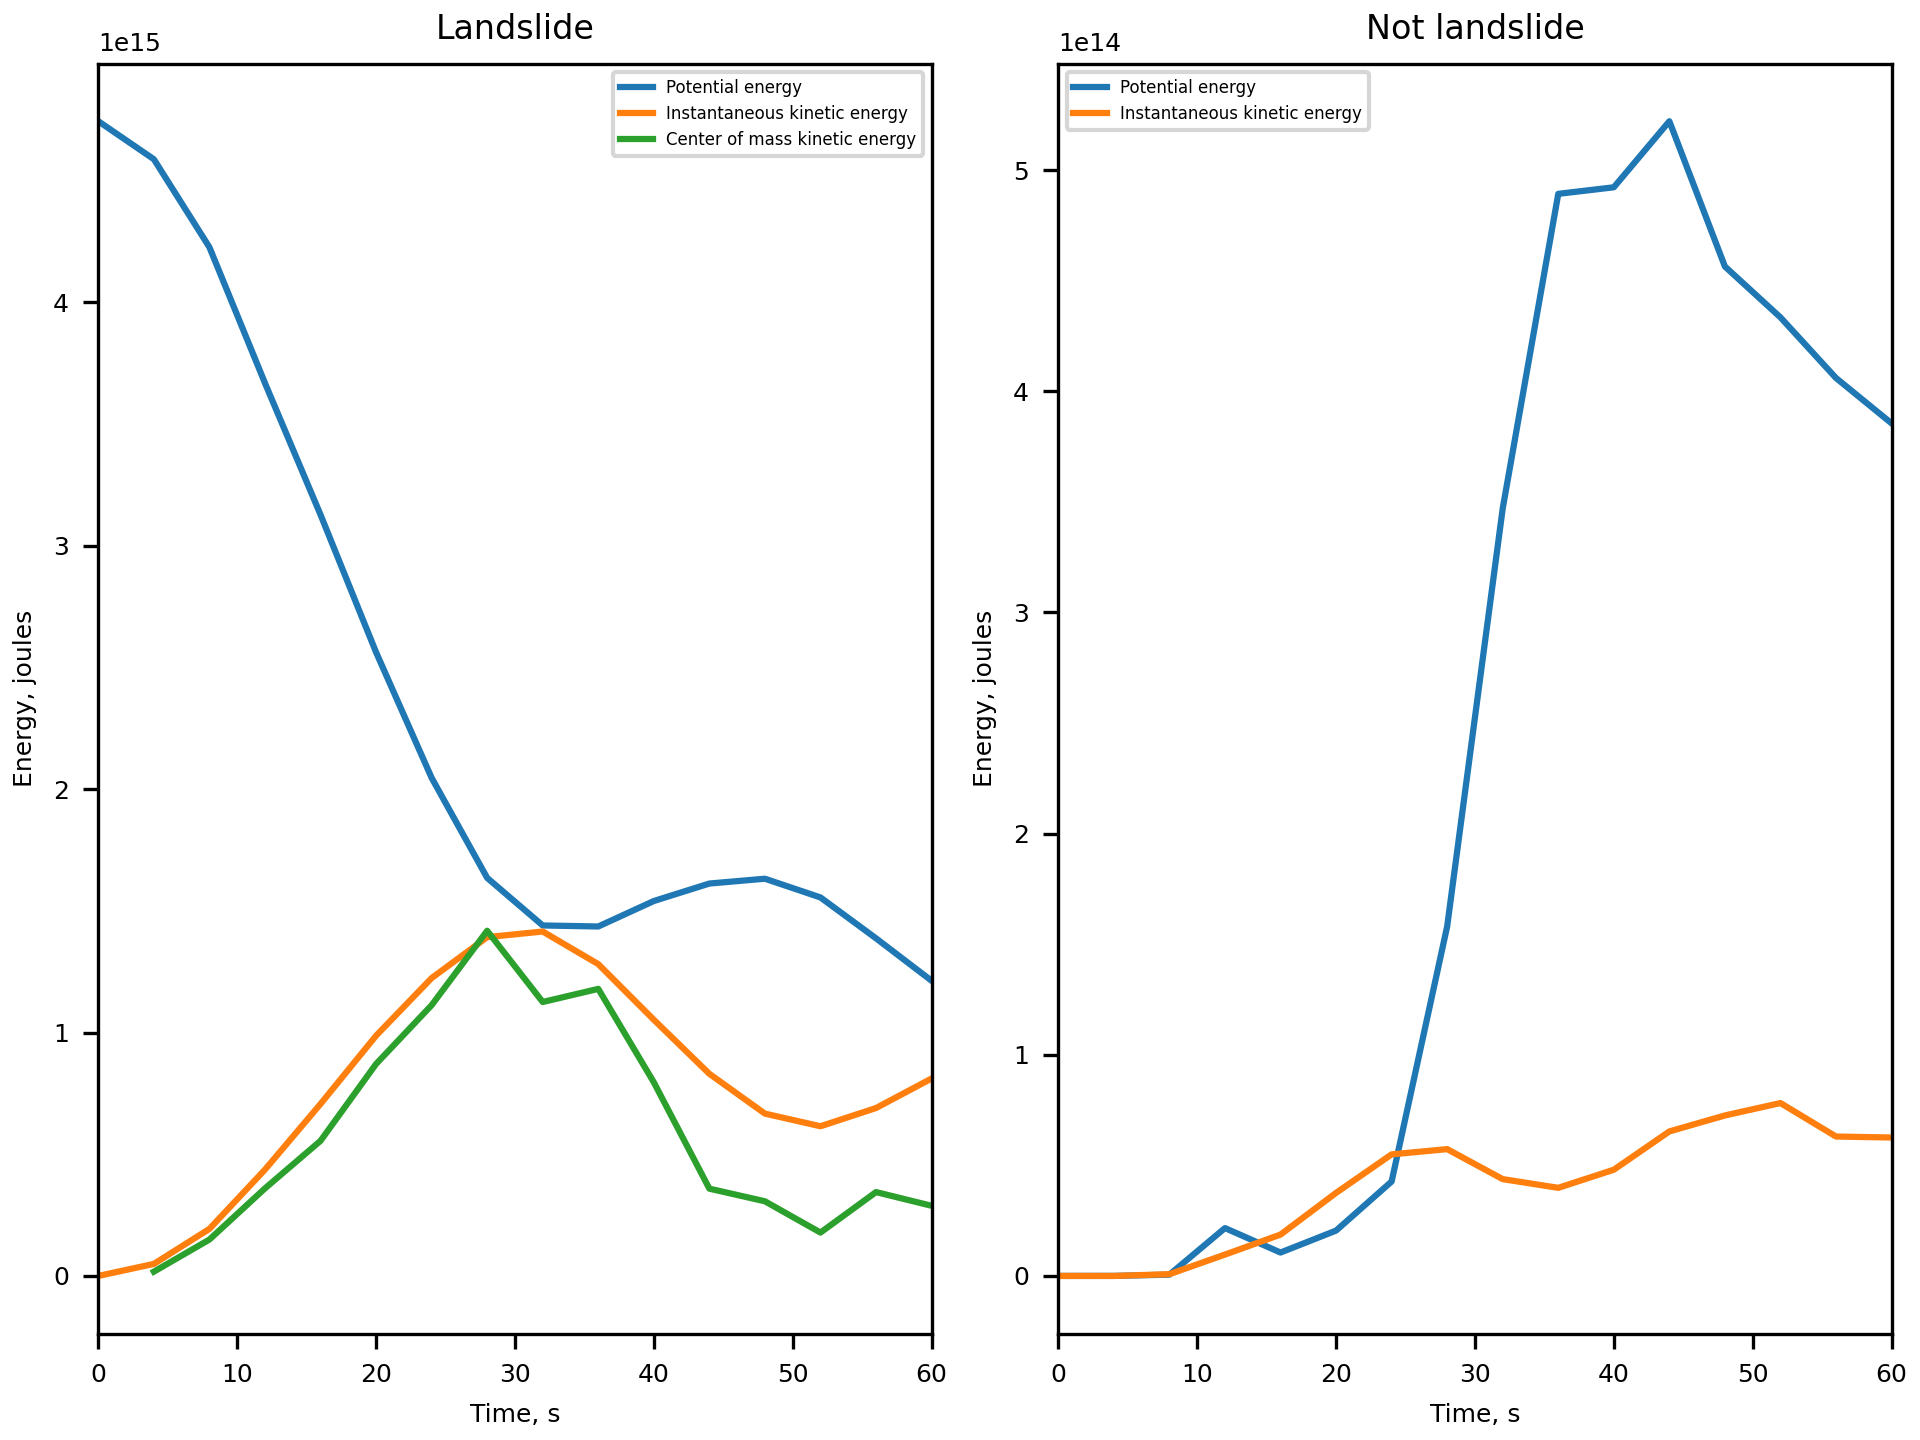
analyze.energetics also generates a number of diagnostic plots to assist the user in understanding how energy is partitioned between landslide potential and kinetic energy through the simulation. These also describe how energy is transferred from the landslide to the surrounding environment (e.g., a water body).
analyze.energetics divides the domain up into landslide and not-landslide based on a user-defined solid volume fraction threshold.
Two of the diagnostic plots are as follows:

Fig. 14 An example of the diagnostic output provided by digger.analyze.energetics that shows the center of mass location through time.

Fig. 15 An example of the diagnostic output provided by digger.analyze.energetics that shows the decomposition of potential and kinetic energy in the landslide and not-landslide over the simulation duration.
References
Iverson, R.M., and George, D.L., 2016, Modelling landslide liquefaction, mobility bifurcation and the dynamics of the 2014 Oso disaster: Geotechnique, v. 66, no. 3, p. 13, https://doi.org/10.1680/jgeot.15.LM.004.