analyze.wavelet
The function analyze.wavelet analyzes a numerical gauge trace using a continuous wavelet transform (the Ricker wavelet is used).
# Wavelet analysis
import numpy as np

from digger import analyze
from digger.utils import gauge2ts

(
    t,
    eta,
) = gauge2ts("_output/gauge00001.txt", samprate=2)
t0 = np.min(t[eta > 0])  # wave arrival time

times, amps, cwt = analyze.wavelet(
    t0=t0,
    simlength=np.max(t),  # simulation duration in seconds
    eta=eta[t > t0],
    samprate=2,  # sample rate from gauge2ts
    gauge=1,
    minwidth=10,
    maxwidth=200,
    nwidths=20,
    waterlevel=0,
    plot=True,
    plotname="wavelet-BA",
)
Attention
This code snippet is not fully self-sufficient. This snippet relies on simulation output files. To reproduce the example, execute the file digger/examples/post-run/barry_arm/setpostprocess.py from within the directory in which it is located. Before the script is executed either the example simulation must be run or the file digger/data/barry_arm_output.zip must be unzipped and the resulting directory (_output) must be placed within digger/examples/post-run/barry_arm/.
Running this code snippet generates two diagnostic figures that depict the detrended gauge and the wavelet analysis scalogram.
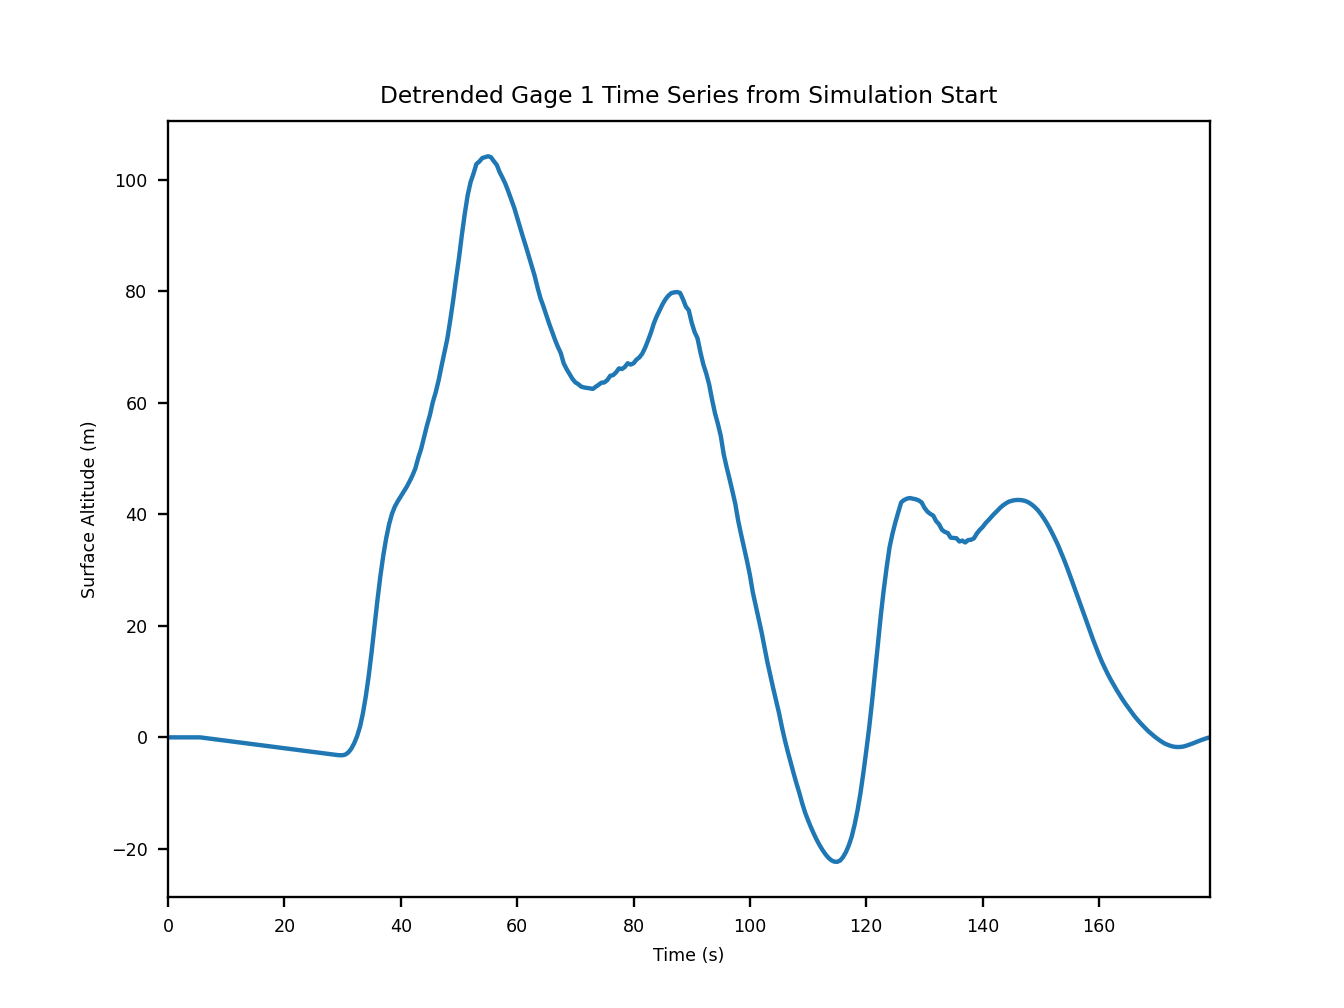
Fig. 22 An example of the diagnostic output provided by digger.analyze.wavelet showing the detrended gauge trace.
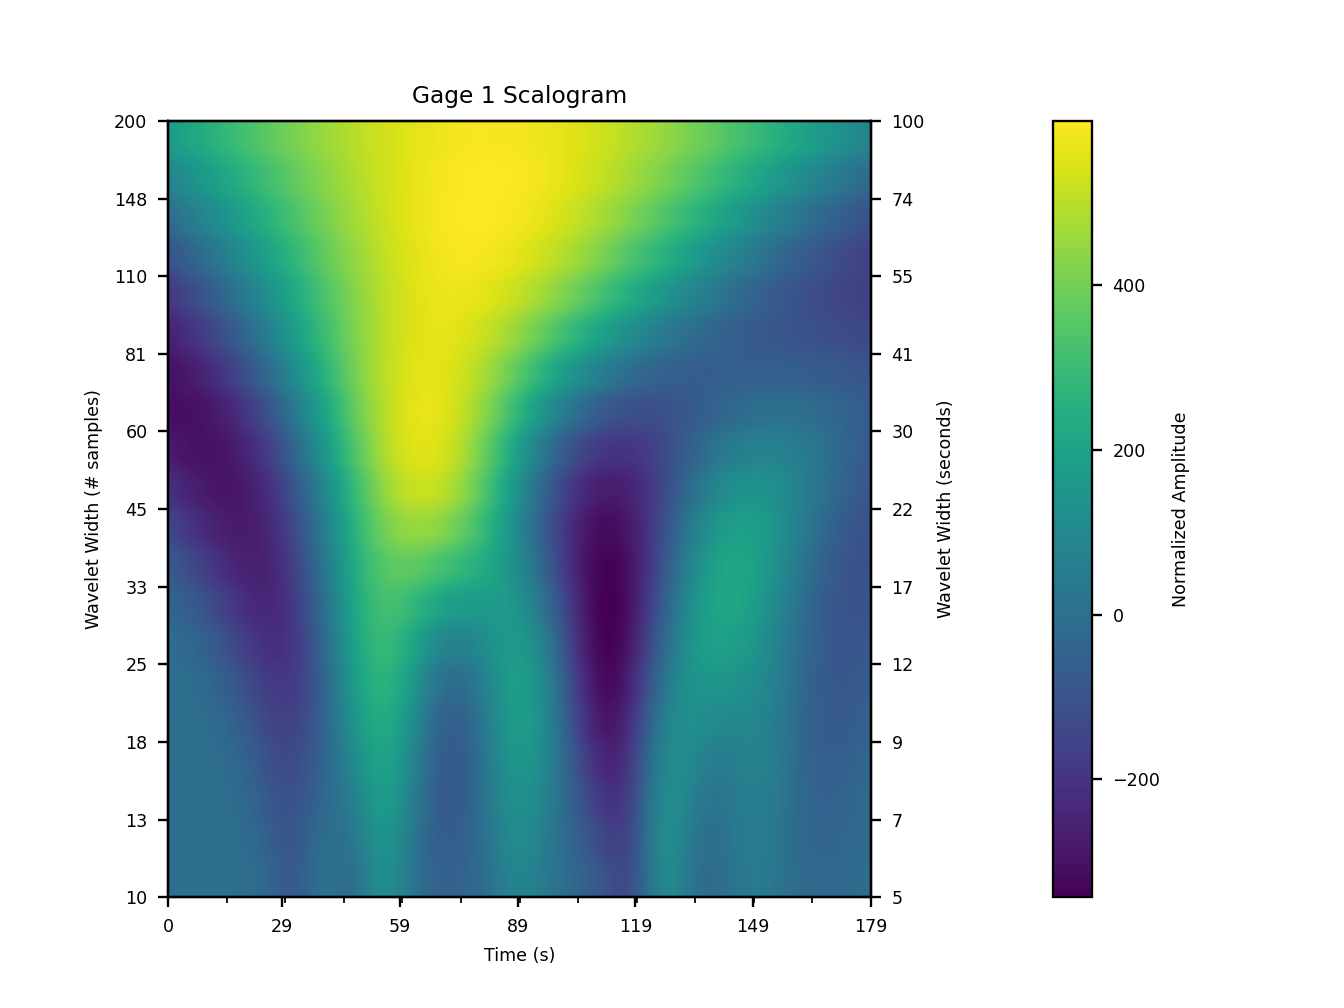
Fig. 23 An example of the diagnostic output provided by digger.analyze.wavelet showing the wavelet scalogram.