plot.xsec_profile
xsec_profile(line, fig=None, show=True, color="blue", title="", region=None, label=None, legend_shift=None, savefile=None)
Makes a 2d profile plot of a cross-section line.
Arguments:
line (pd.DataFrame): data for cross-section line.
fig (pygmt.Figure, optional): figure object to add features to. Defaults to False.
show (bool, optional): displays the figure. Defaults to True.
color (str, optional): color to plot the cross-section line with. Defaults to ‘blue’.
title (str, optional): title for the figure. Defaluts to empty string.
region (list, optional): specifies figure axes sizes. Defaults to None.
label (str, optional): label for cross-section. Defaults to None.
legend_shift (float, optional): shifts legend position if plotting two lines. Defaults to None.
savefile (str, optional): file path to save figure to. Defaults to None.
Returns:
None
Example
import plot
# load in the synthetic test model as a slab_model instance
model = plot.slab_model("../output/exp_slab2_04-18","surface") # synthetic test slab made with the 04-18 database
# make a cross-section line and save to variable
line = plot.xsec(
    model.dep_grid, # run line through the depth grid
    128, # setting the line reference point to 128 degrees longitude
    1, # setting the line reference point to 1 degree latitude
    110, # setting the line orientation to 110 degrees
    model.clp, # using the model clipping mask
)
# plotting the profile of the line defined above
plot.xsec_profile(
    line=line, # defining the cross-section line to use
    show=True, # display the figure
    color="blue", # plot the line in blue
    title="Test Slab Cross-Section", # add a title to the plot
    region=None, # here, 'region' refers to the horizontal and vertical extent of the line, will generate automatically
    label="exp 04-18", # label the line in a legend
    savefile="output/exp_slab2_xsec_profile.jpg", # file save location
)
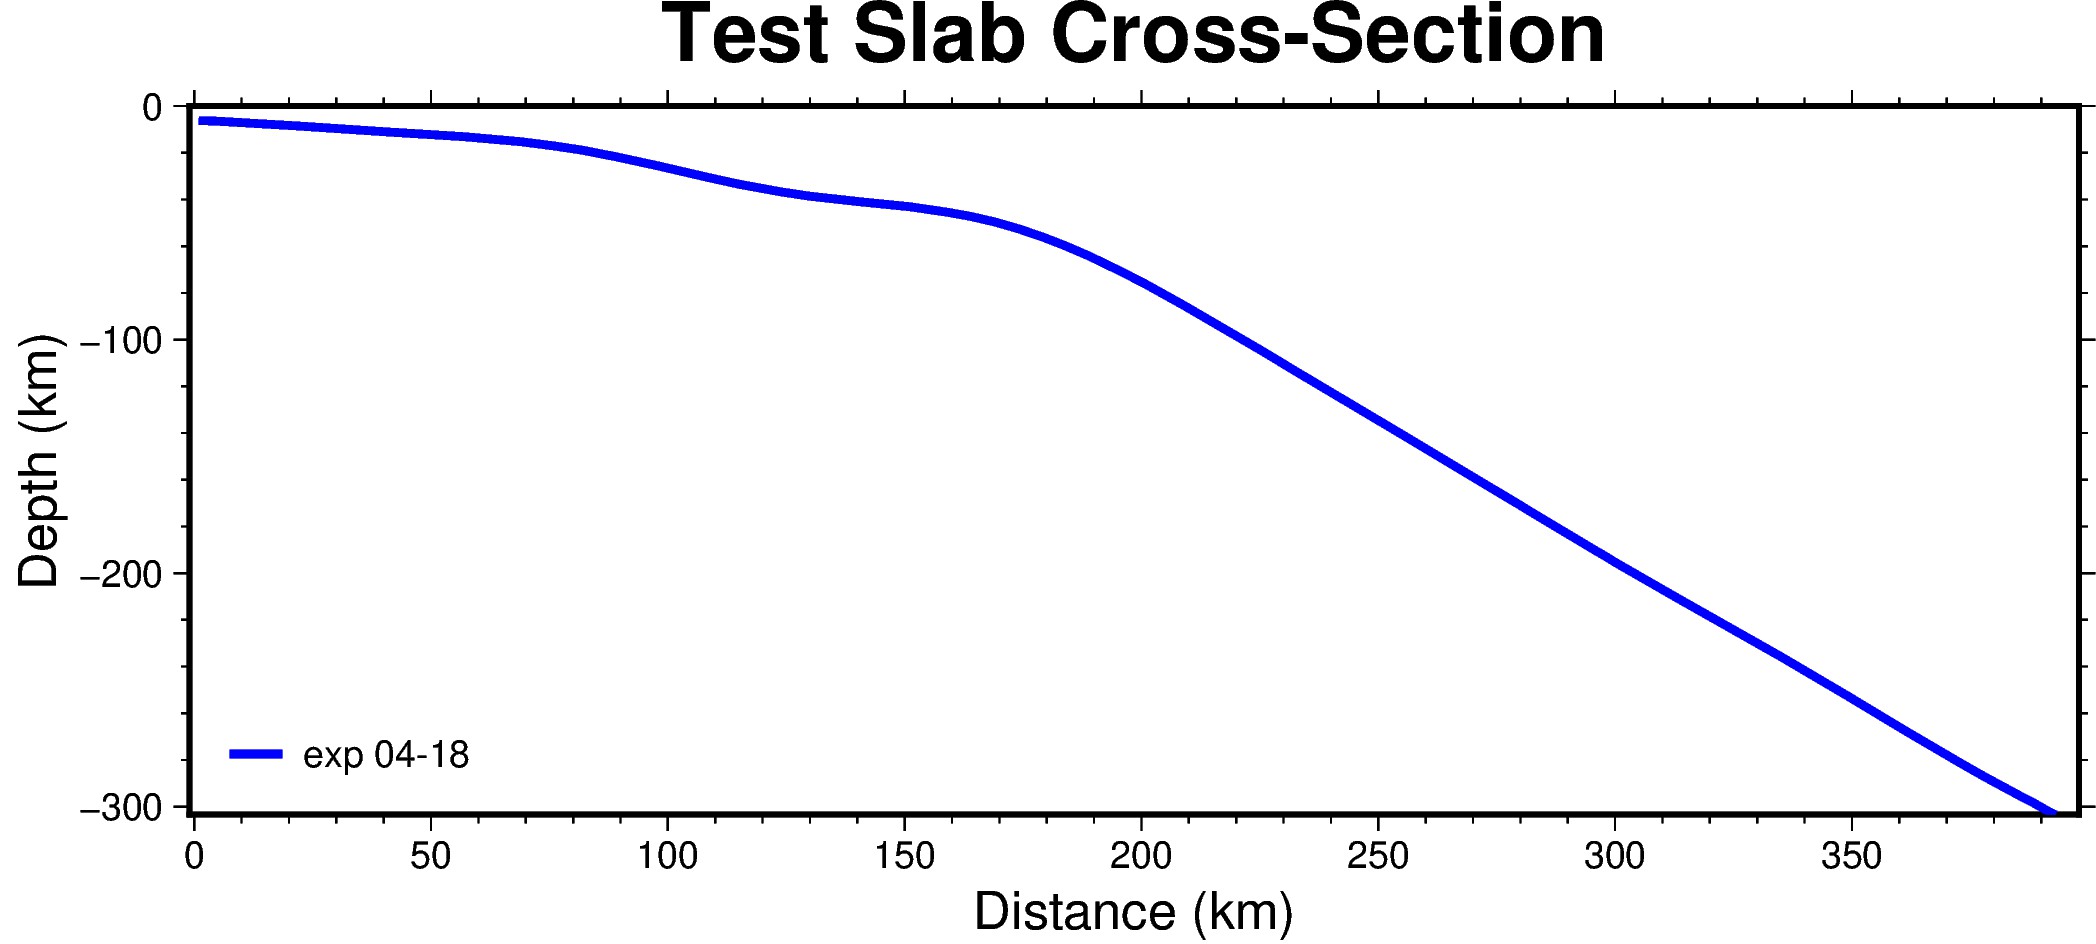
Output of example shown above