plot.plot_3d
plot_3d(grid, fig=None, data=None, etype=None, perspective=[135,30], zscale=0.01, savefile=None, show=True)
Makes a 3-Dimensional surface plot of grid data.
Arguments:
grid (xr.DataArray or str): grid object to plot.
fig (pygmt.Figure, optional): figure to add plot to
data (pandas.DataFrame or str, optional): input data to be plotted. Defaluts to None
etype (list, optional): list of input data types to be plotted. Defaults to None (will plot all types if None).
perspective (list, optional): specifies the perspective of the plot [azimuth angle, elevation angle]. Defaluts to [135,30].
zscale (float, optional): scaling factor for z-axis. Defaluts to 0.01.
savefile (str, optional): optionally saves figure to path specified here. Defaults to None.
show (bool, optional): enable/ disable showing figure in output. Defaults to False.
Returns:
None
Example:
import plot
# load in the synthetic test model as a slab_model instance
model = plot.slab_model("../output/exp_slab2_04-18","surface") # synthetic test slab made with the 04-18 database
# making a 3d plot of slab depth with input data
plot.plot_3d(
    model.dep_grid, # specify the depth grid object
    data=model.input, # specify the input data to use
    etype="EQ", # constrain input data to just earthquake events
    perspective=[135,30], # specify the viewing angle with an azimuth of 135 degrees and vertical 30 degrees from the horizon
    savefile="output/exp_slab2_dep_3d.jpg", # save the figure to a jpeg file
    show=True, # display the figure
)
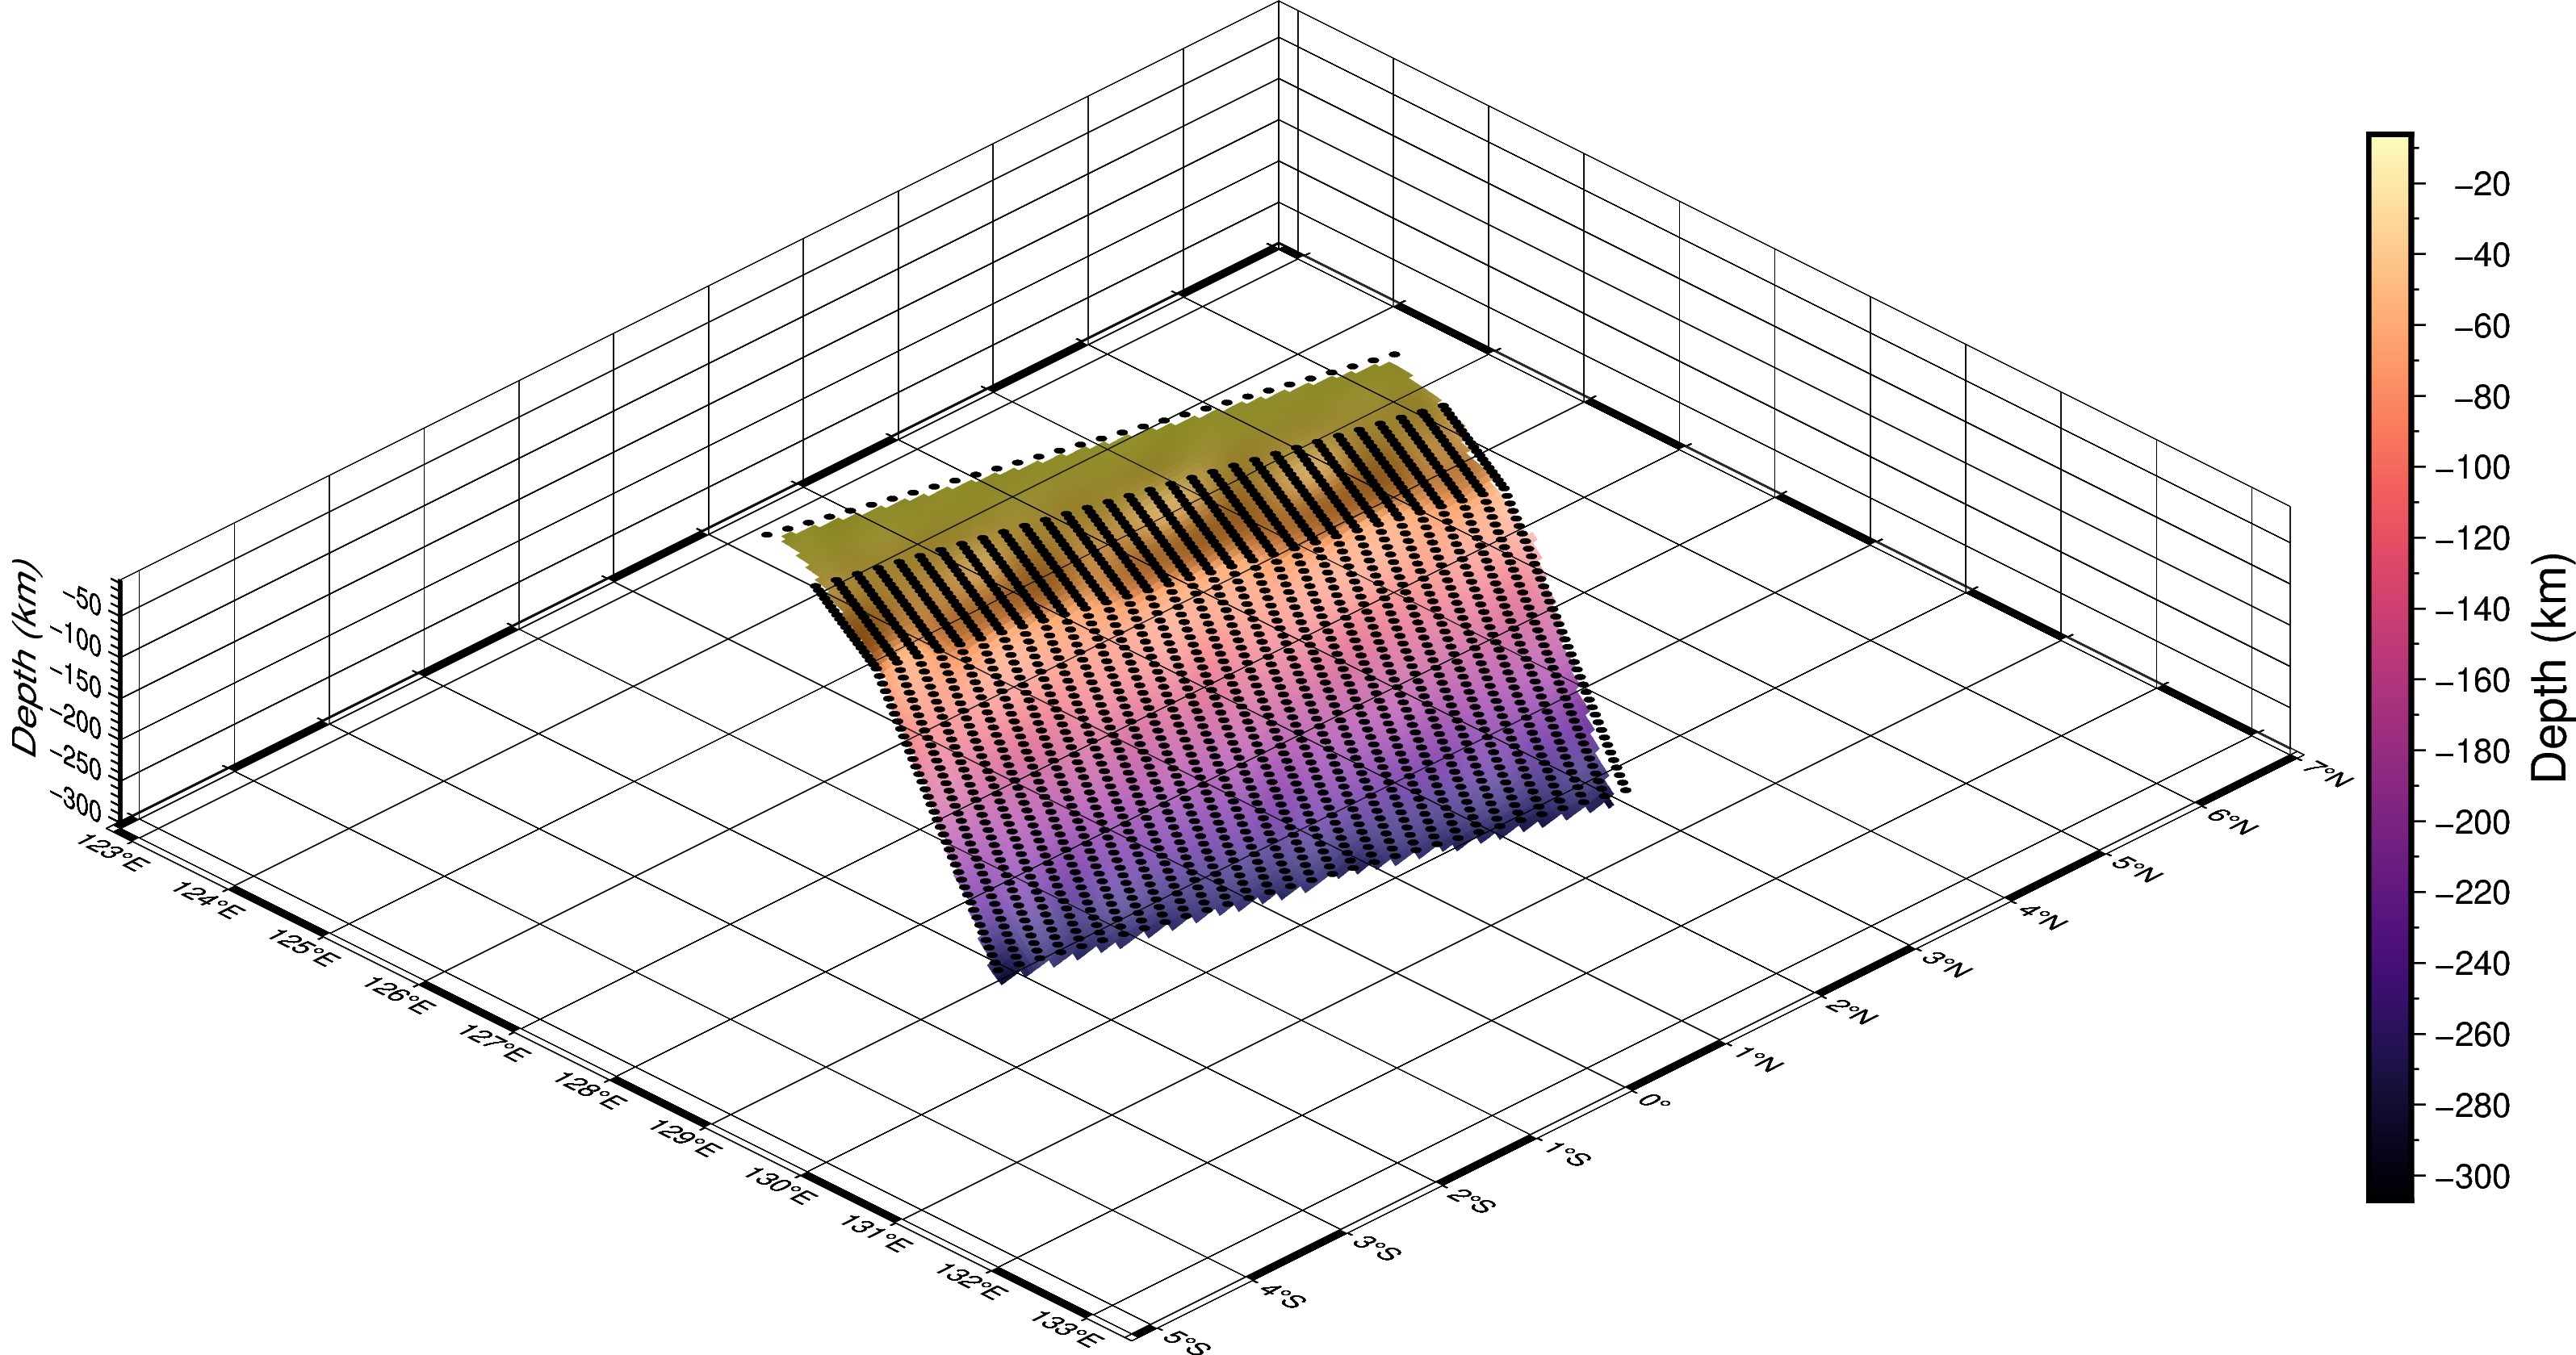
Output of example shown above