plot.xsec_plot
xsec_plot(grid, line, basemap=True, savefile=None, show=True, label=None, contours=False, title="")
Plots cross-section of a line and its trace in map view.
Arguments:
grid (xr.DataArray or str): grid object to be plotted in map view.
line (pd.DataFrame): data for cross-section line.
basemap (bool, optional): option to add basemap to plot. Defaluts to True.
savefile (str, optional): optionally saves figure to path specified here. Defaluts to None
show (bool, optional): enable/ disable showing figure in output. Defaluts to True.
label (str, optional): label for cross-section line. Defaluts to None.
title (str, optional): title for the figure. Defaults to empty string.
Returns:
None
Example
import plot
# load in the synthetic test model as a slab_model instance
model = plot.slab_model("../output/exp_slab2_04-18","surface") # synthetic test slab made with the 04-18 database
# make a cross-section line and save to variable
line = plot.xsec(
    model.dep_grid, # run line through the depth grid
    128, # setting the line reference point to 128 degrees longitude
    1, # setting the line reference point to 1 degree latitude
    110, # setting the line orientation to 110 degrees
    model.clp, # using the model clipping mask
)
# making a plot of the line in map view
plot.xsec_plot(
    model.dep_grid, # use the model depth grid
    line, # use the line defined above
    basemap=True, # plot the basemap below
    savefile="output/exp_slab2_xsec.jpg", # save figure to jpeg file
    show=True, # display the figure
    label="exp 04-18", # label the line in a legend
    title="Test Slab Cross-Section", # add a title to the plot
)
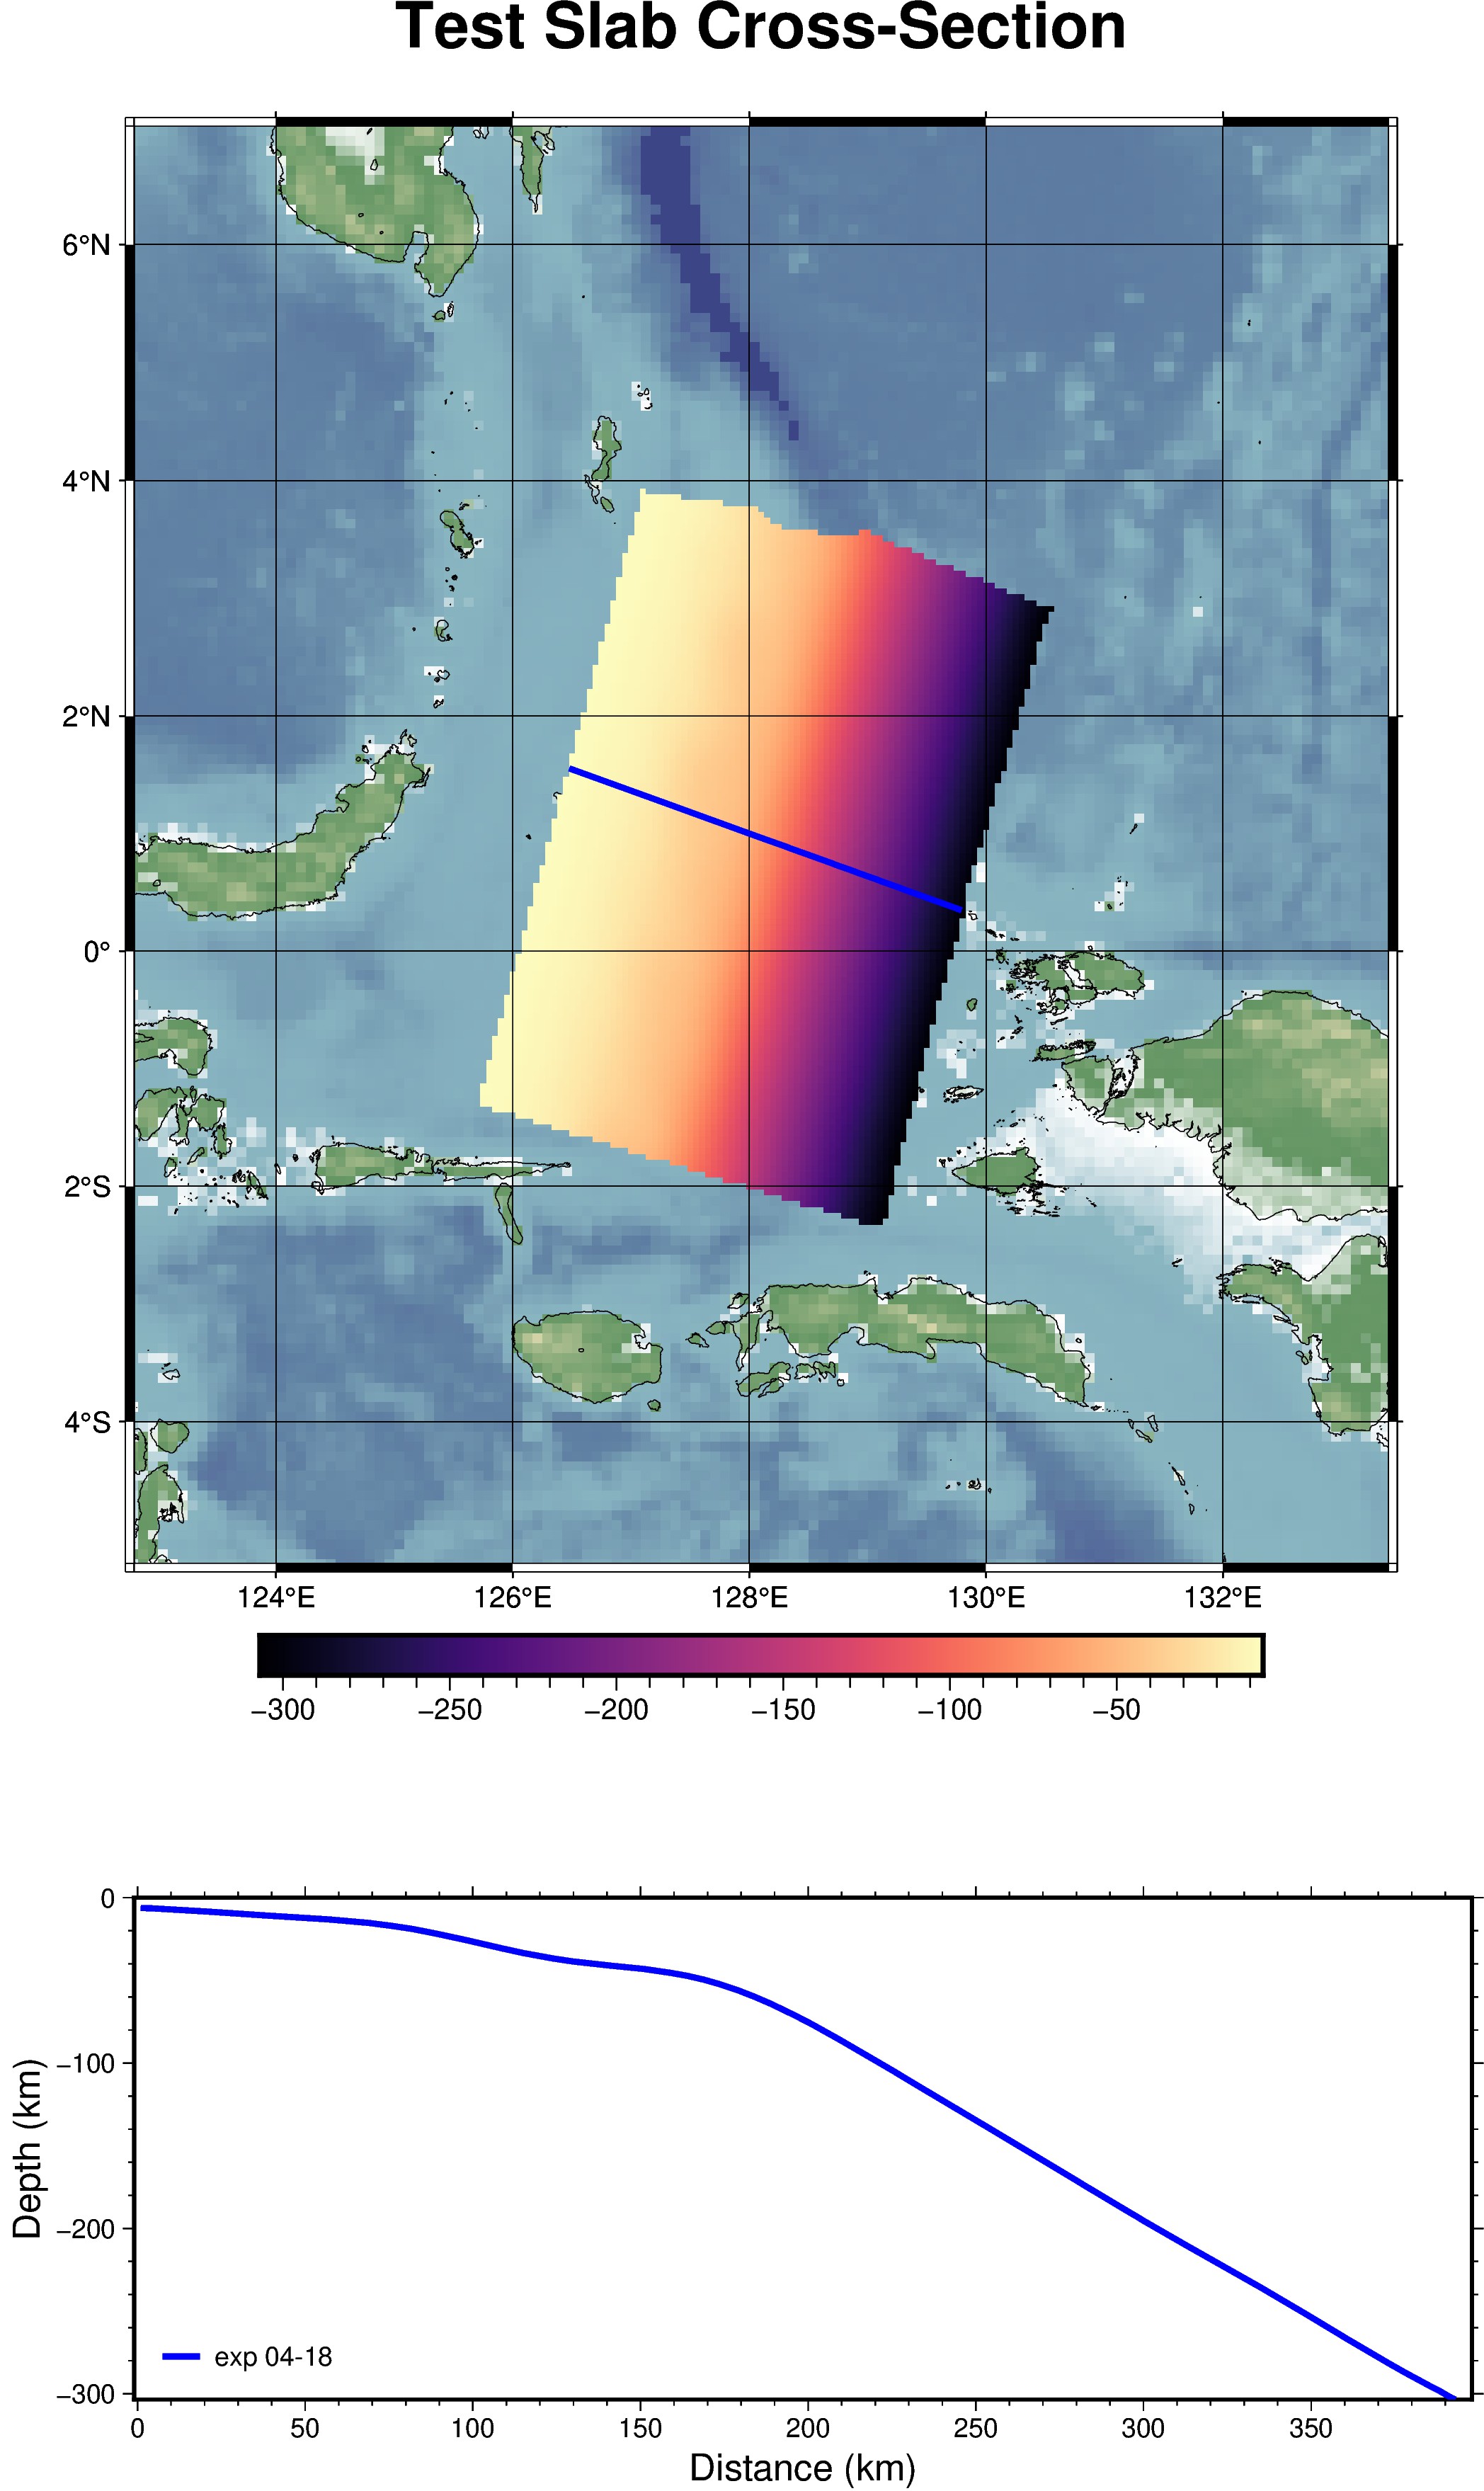
Output of example shown above