Command Line Interface
This example covers using the gmrecords command line program in a typical workflow for downloading, processing, and generating products for ground-motion records from an earthquake.
The configuration and parameter files are in the docs/contents/tutorials directory.
See also
Be sure to review the discussion of all of the gmrecords subcommands in section The gmrecords Program and configuring projects in section Initial Setup.
Local gmprocess configuration
In this example we specify parameters in the project configuration to produce a small dataset.
We use only the FDSN fetcher and limit the station distance to 0.1 degrees.
The configuration files are in the conf/cli directory.
First, we list the available projects in the current directory.
$ gmrecords projects --list
INFO 2026-07-18 22:56:12 | gmrecords._initialize: Logging level includes INFO.
INFO 2026-07-18 22:56:12 | gmrecords._initialize: PROJECTS_PATH: /builds/ghsc/esi/groundmotion-processing/docs/contents/tutorials/.gmprocess
INFO 2026-07-18 22:56:12 | projects.main: Running subcommand 'projects'

Project: cli-tutorial
	Conf Path: /builds/ghsc/esi/groundmotion-processing/docs/contents/tutorials/conf/cli
	Data Path: /builds/ghsc/esi/groundmotion-processing/docs/contents/tutorials/data/cli


Project: scripting-tutorial **Current Project**
	Conf Path: /builds/ghsc/esi/groundmotion-processing/docs/contents/tutorials/conf/scripting
	Data Path: /builds/ghsc/esi/groundmotion-processing/docs/contents/tutorials/data/scripting
The PROJECTS_PATH shows the location of the projects configuration file where the information for the projects is stored.
Second, we use the projects subcommand to select the project configuration cli-tutorial.
$ gmrecords projects --switch cli-tutorial
INFO 2026-07-18 22:56:15 | gmrecords._initialize: Logging level includes INFO.
INFO 2026-07-18 22:56:15 | gmrecords._initialize: PROJECTS_PATH: /builds/ghsc/esi/groundmotion-processing/docs/contents/tutorials/.gmprocess
INFO 2026-07-18 22:56:15 | projects.main: Running subcommand 'projects'

Switched to project:
Project: cli-tutorial **Current Project**
	Conf Path: /builds/ghsc/esi/groundmotion-processing/docs/contents/tutorials/conf/cli
	Data Path: /builds/ghsc/esi/groundmotion-processing/docs/contents/tutorials/data/cli
Third, we create the directory to hold the data.
Note
We include the directory with the processing parameters for the project in the source code.
$ mkdir -p data/cli
$ pwd
/builds/ghsc/esi/groundmotion-processing/docs/contents/tutorials
At this point we have an empty data/cli directory.
The conf/cli directory has two files: fetchers.yml and user.yml.
These configuration files hold parameters that override default values provided with the source code.
See Configuration File for more detailed information.
For example, a common change would be to disable the KNETFetcher if it is not needed by changing the enabled keyword to False:
fetchers:
    KNETFetcher:
        enabled: False
Another example would be to modify the processing steps, which involves replacing the steps listed in the processing section and optionally changing some of their arguments.
If one wanted to do only a minimal set of processing steps, and apply a constant conrner frequency for filtering, the processing section could be modified to this:
processing:
    - detrend:
        detrending_method: demean
    - remove_response:
    - get_corner_frequencies:
        method: constant
        constant:
          highpass: 0.08
          lowpass: 20.0
    - highpass_filter:
    - lowpass_filter:
Download Data
In this example we will consider ground motions recorded for a magnitude 4.5 earthquake east of San Francisco, California.
We download data from FDSN data centers using the USGS ComCat event ID nc73291880.
gmrecords --eventid nc73291880 download
We have cached a subset of the results of running gmrecords download --eventid nc73291880 in the tests/data/tutorials directory.
Consequently, we simply copy the data from tests/data/tutorials/nc73291880 to data/cli/nc73291880.
$ cp -r ../../../tests/data/tutorials/nc73291880 data/cli/.
List Data
We now have earthquake rupture information and raw waveforms in the data/cli directory.
$ tree data/cli
data/cli
└── nc73291880
    ├── event.json
    └── raw
        ├── BK.BRIB.01.HNE__20191015T053312Z__20191015T054042Z.mseed
        ├── BK.BRIB.01.HNN__20191015T053312Z__20191015T054042Z.mseed
        ├── BK.BRIB.01.HNZ__20191015T053312Z__20191015T054042Z.mseed
        └── BK.BRIB.xml

3 directories, 5 files
Note the tree command may not be available on your system and this part can be skipped.
From the directory tree above, you can see how gmrecords organizes the data directory:
within the root data directory there are subdirectories for each event named by the event ID,
within each event directory there is
an
event.jsonfile that stores event information that were retrieved from the USGS data,a
rawdirectory that holds the downloaded raw data. In this case, that consists of miniseed and StationXML files,The downloaded data is contained within the
rawdirectory.The
rawdirectory also has PNG files that are plots of the raw data.
a
rupture.jsonfile that includes information about the rupture extent.
Assemble Data
The assemble subcommand collects the data in the raw directory and organizes it into an ASDF file.
If we do not specify the event ID, then all of the events in the data directory will be assembled.
$ gmrecords assemble
INFO 2026-07-18 22:56:17 | gmrecords._initialize: Logging level includes INFO.
INFO 2026-07-18 22:56:17 | gmrecords._initialize: PROJECTS_PATH: /builds/ghsc/esi/groundmotion-processing/docs/contents/tutorials/.gmprocess
INFO 2026-07-18 22:56:17 | assemble.main: Running subcommand 'assemble'
INFO 2026-07-18 22:56:17 | assemble.main: Number of events to assemble: 1
INFO 2026-07-18 22:56:17 | assemble.main: Assembling event nc73291880 (1 of 1)...
INFO 2026-07-18 22:56:17 | assemble._assemble_event: Calling assemble function for nc73291880...
INFO 2026-07-18 22:56:19 | assemble_utils.load_rupture: Rupture geometry file not found.
INFO 2026-07-18 22:56:20 | assemble_utils.assemble:
1 StationStreams(s) in StreamCollection:
  3 StationTrace(s) in StationStream (passed):
    BK.BRIB.01.HNE | 2019-10-15T05:33:12.810000Z - 2019-10-15T05:40:42.800000Z | 100.0 Hz, 45000 samples (passed)
    BK.BRIB.01.HNN | 2019-10-15T05:33:12.810000Z - 2019-10-15T05:40:42.800000Z | 100.0 Hz, 45000 samples (passed)
    BK.BRIB.01.HNZ | 2019-10-15T05:33:12.810000Z - 2019-10-15T05:40:42.800000Z | 100.0 Hz, 45000 samples (passed)
INFO 2026-07-18 22:56:20 | stream_workspace.add_streams: Adding waveforms for BK.BRIB.01.HN
INFO 2026-07-18 22:56:20 | assemble._assemble_event: Done with assemble function for nc73291880...
INFO 2026-07-18 22:56:20 | base._summarize_files_created: The following files have been created:
INFO 2026-07-18 22:56:20 | base._summarize_files_created: File type: Workspace
INFO 2026-07-18 22:56:20 | base._summarize_files_created: 	/builds/ghsc/esi/groundmotion-processing/docs/contents/tutorials/data/cli/nc73291880/workspace.h5
--------------------------------------------------------------------------------
Project: cli-tutorial **Current Project**
	Conf Path: /builds/ghsc/esi/groundmotion-processing/docs/contents/tutorials/conf/cli
	Data Path: /builds/ghsc/esi/groundmotion-processing/docs/contents/tutorials/data/cli
--------------------------------------------------------------------------------
The console message indicates that the workspace.h5 ASDF file has been created.
Note
The Seismic Data folks have developed a graphical user interface to explore ASDF data sets called ASDF Sextant and this may be useful for browsing the contents of the ASDF file. Since ASDF is an HDF5 specification, it can also be loaded in most programming languages using HDF5 libraries.
Process Waveforms
The process_waveforms (or just process for short) subcommand reads in the raw data from the ASDF workspace files that were created by the assemble subcommand, and then applies the waveform processing steps that are specified the config file (in the processing section).
The processed waveforms are then added to the ASDF workspace file.
$ gmrecords process_waveforms
INFO 2026-07-18 22:56:23 | gmrecords._initialize: Logging level includes INFO.
INFO 2026-07-18 22:56:23 | gmrecords._initialize: PROJECTS_PATH: /builds/ghsc/esi/groundmotion-processing/docs/contents/tutorials/.gmprocess
INFO 2026-07-18 22:56:23 | process_waveforms.main: Running subcommand 'process_waveforms'
INFO 2026-07-18 22:56:23 | process_waveforms.main: Number of events to process: 1
INFO 2026-07-18 22:56:23 | process_waveforms.main: Processing tag: default
INFO 2026-07-18 22:56:23 | process_waveforms.main: Processing waveforms for event nc73291880 (1 of 1)...
INFO 2026-07-18 22:56:23 | process_waveforms._process_event: Processing 'unprocessed' streams for event nc73291880...
INFO 2026-07-18 22:56:26 | processing.process_streams: Stream: BK.BRIB.01.HN
INFO 2026-07-18 22:56:32 | stream_workspace.add_streams: Adding waveforms for BK.BRIB.01.HN
INFO 2026-07-18 22:56:32 | base._summarize_files_created: No new files created.
--------------------------------------------------------------------------------
Project: cli-tutorial **Current Project**
	Conf Path: /builds/ghsc/esi/groundmotion-processing/docs/contents/tutorials/conf/cli
	Data Path: /builds/ghsc/esi/groundmotion-processing/docs/contents/tutorials/data/cli
--------------------------------------------------------------------------------
Note that the console messages indicate that some of the traces failed due to clipping or signal-to-noise requirements.
Generate Report
The generate_report subcommand will generate a PDF report for each earthquake, if latex is installed.
The report is useful to review which streams failed and why.
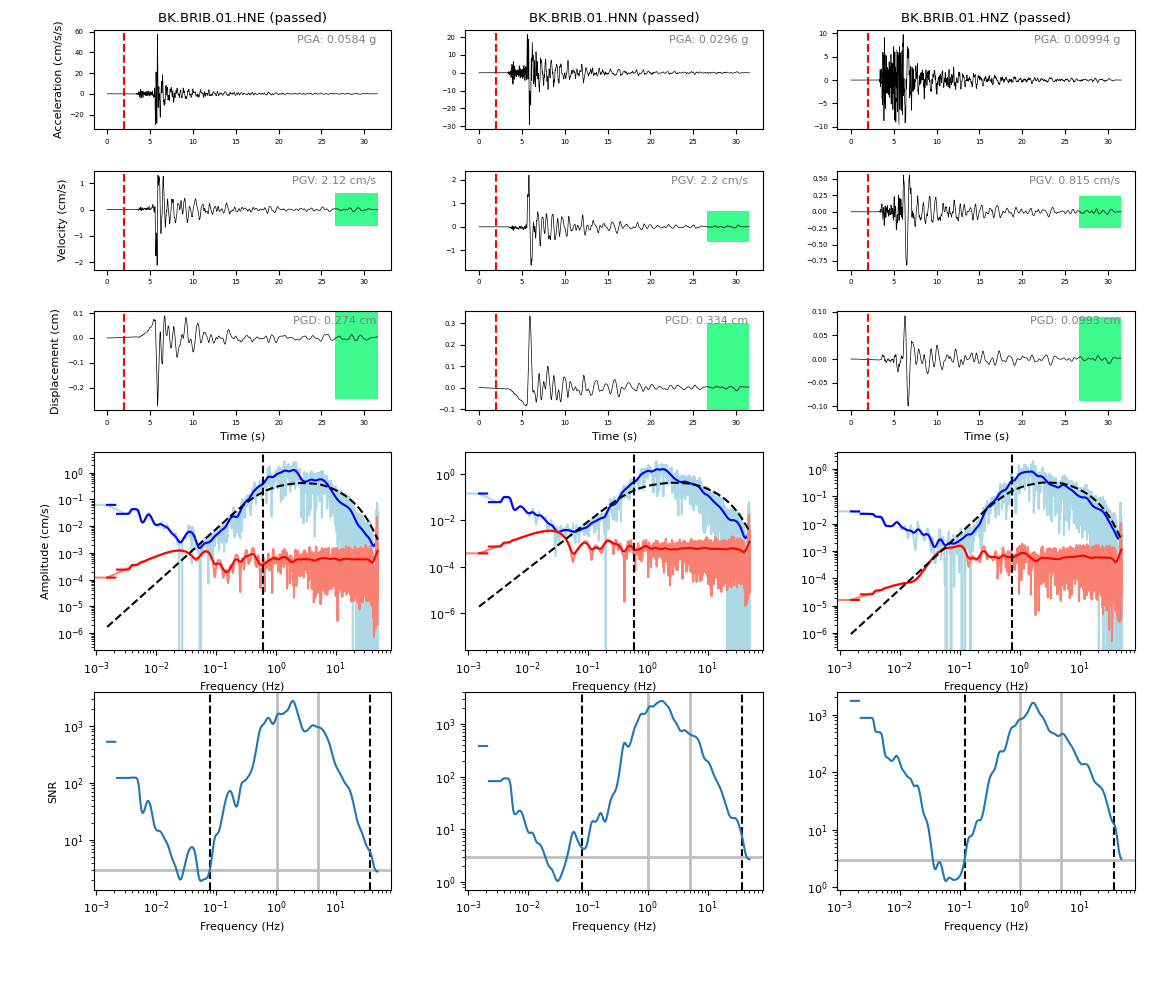
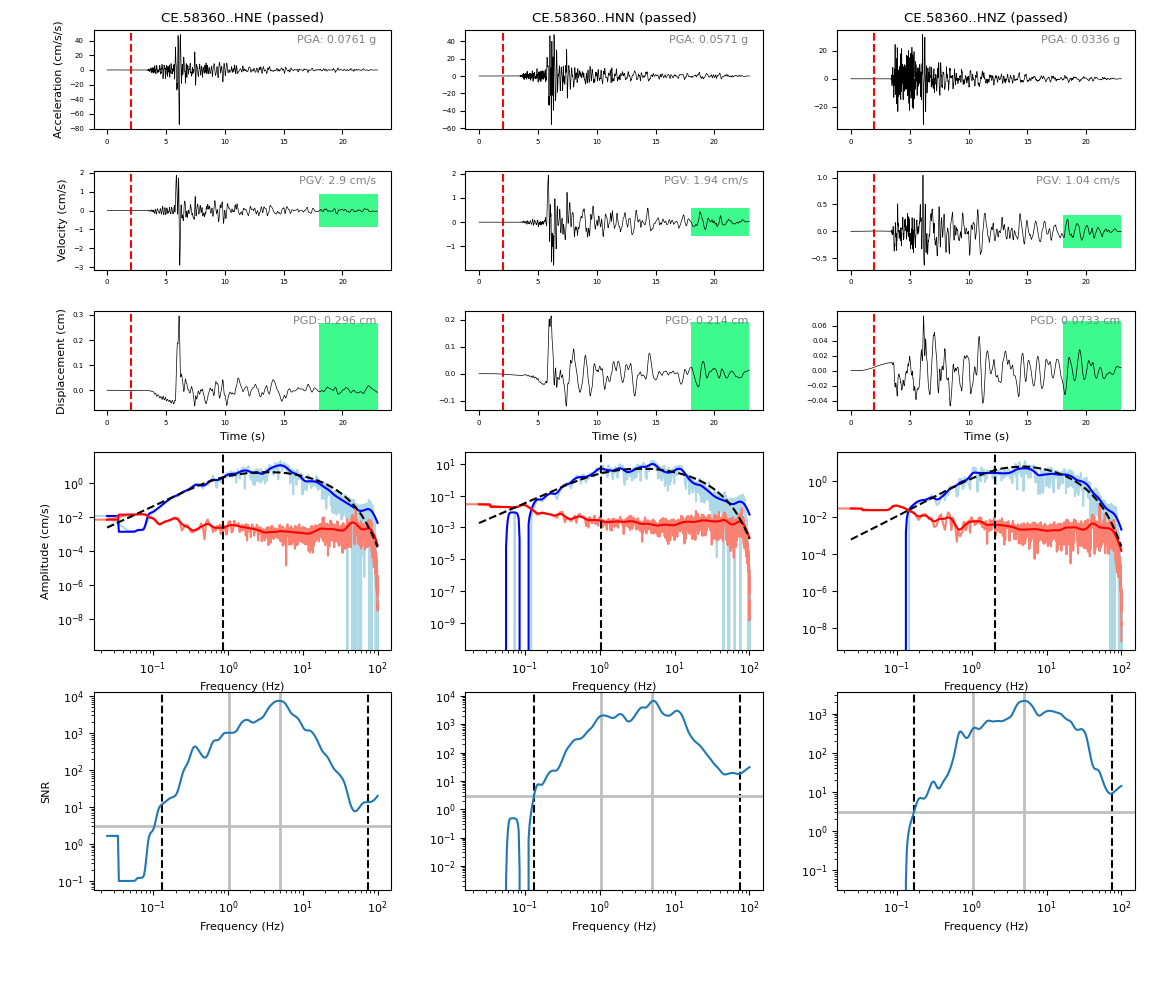
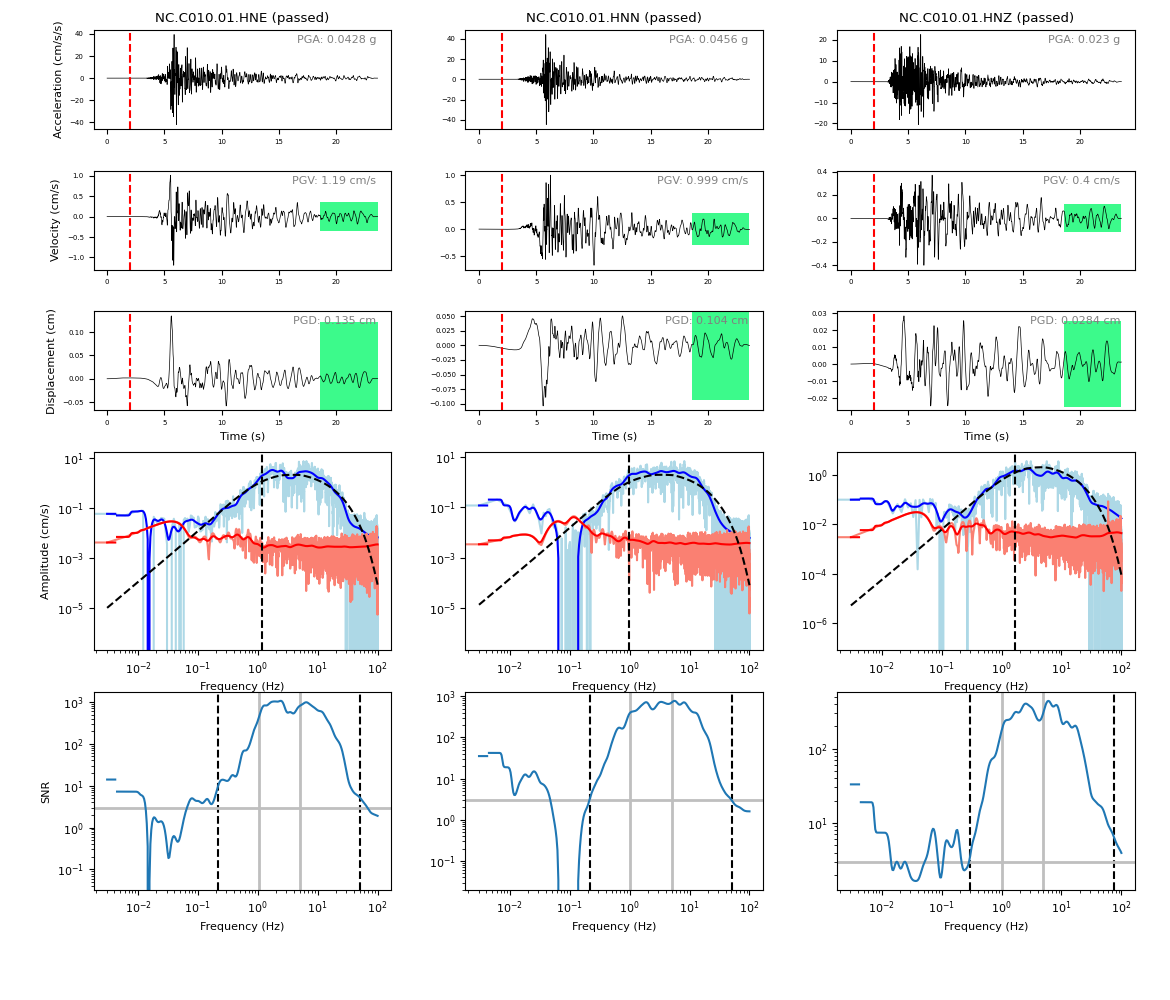
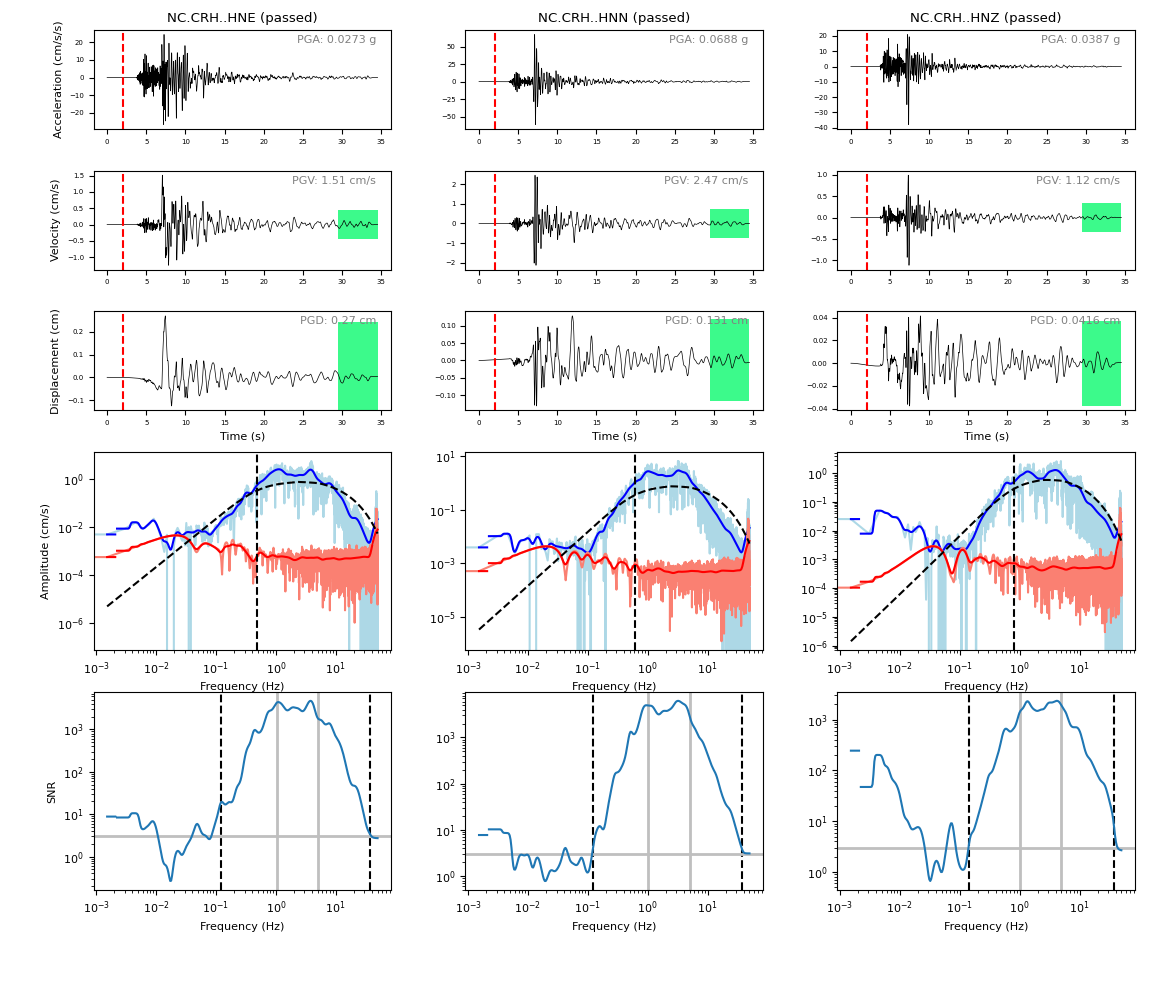
The report gives a 1-page summary per station that includes:
the acceleration, velocity, and displacement plots,
the location where the signal and noise windows were split,
the signal and noise spectra (raw and smoothed), and
a table of the processing steps applied to the record.
the failure reason for stations that have failed.
shaded green regions that show range in acceptable amplitudes in the tail of the trace for a “sanity” check; this check is designed to remove records with unnatural drifts in the waveform.
$ gmrecords generate_report
INFO 2026-07-18 22:56:35 | gmrecords._initialize: Logging level includes INFO.
INFO 2026-07-18 22:56:35 | gmrecords._initialize: PROJECTS_PATH: /builds/ghsc/esi/groundmotion-processing/docs/contents/tutorials/.gmprocess
INFO 2026-07-18 22:56:35 | generate_report.main: Running subcommand 'generate_report'
INFO 2026-07-18 22:56:36 | generate_report.generate_diagnostic_plots: Creating diagnostic plots for event nc73291880...
--------------------------------------------------------------------------------
Project: cli-tutorial **Current Project**
	Conf Path: /builds/ghsc/esi/groundmotion-processing/docs/contents/tutorials/conf/cli
	Data Path: /builds/ghsc/esi/groundmotion-processing/docs/contents/tutorials/data/cli
--------------------------------------------------------------------------------

  0%|          | 0/1 [00:00<?, ?it/s]
100%|██████████| 1/1 [00:03<00:00,  3.10s/it]
100%|██████████| 1/1 [00:03<00:00,  3.10s/it]
INFO 2026-07-18 22:56:39 | generate_report.main: Generating summary report for event nc73291880 (1 of 1)...
INFO 2026-07-18 22:56:39 | base._summarize_files_created: No new files created.
We show plots from the summaries for 5 stations.
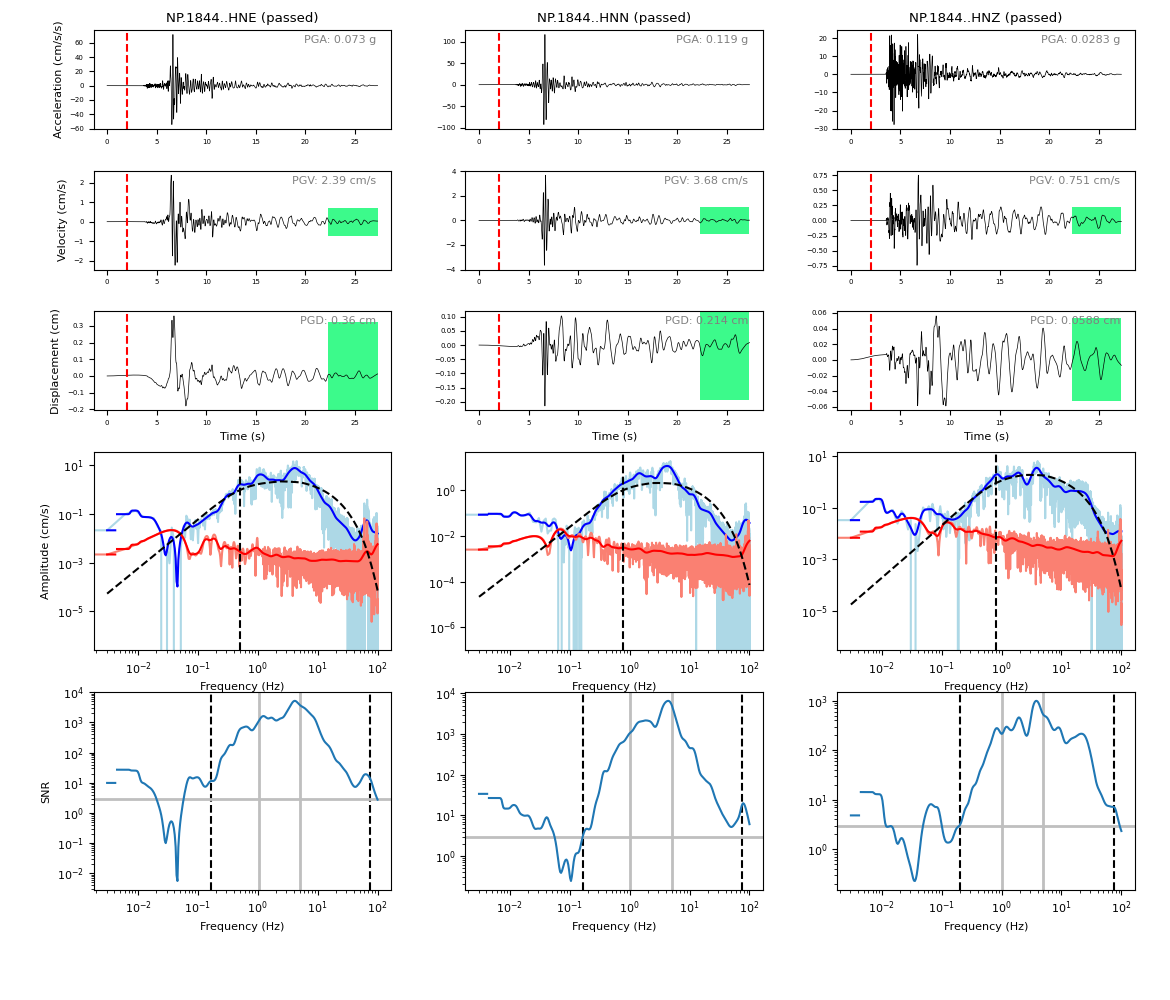
Report Explanation
The full report for each station also includes the provenance table and failure reason (not shown here). The first row of plots is the acceleration time series. The vertical dashed red line indicates the boundary between the signal and noise windows where it is about 1–2 seconds before the P-wave arrival time. The second row of plots is the velocity time series, and the third row of plots is the displacement time series. The blue and red colors indicate the signal and noise respectively.
The fourth row of plots gives the raw and smoothed Fourier amplitude spectra, where the dashed black curve is a Brune spectra fit to the data, and the vertical dashed line is the corner frequency. The fifth row of plots is the signal-to-noise ratio (SNR), where the vertical grey lines indicate the band where the SNR criteria are required, the horizontal grey line is the minimum SNR, and the vertical black dashed lines are the selected bandpass filter corners. Note: Due to recent changes in code development, your output may not look exactly like the one shown.
Compute Station Metrics
The compute_station_metrics subcommand computes station metrics (like epicentral distance) and add them to the ASDF workspace file.
$ gmrecords compute_station_metrics
INFO 2026-07-18 22:56:42 | gmrecords._initialize: Logging level includes INFO.
INFO 2026-07-18 22:56:42 | gmrecords._initialize: PROJECTS_PATH: /builds/ghsc/esi/groundmotion-processing/docs/contents/tutorials/.gmprocess
INFO 2026-07-18 22:56:42 | compute_station_metrics.main: Running subcommand 'compute_station_metrics'
INFO 2026-07-18 22:56:42 | compute_station_metrics.main: Computing station metrics for event nc73291880 (1 of 1)...
INFO 2026-07-18 22:56:47 | compute_station_metrics._event_station_metrics: Added station metrics to workspace files with tag 'default'.
INFO 2026-07-18 22:56:47 | base._summarize_files_created: No new files created.
--------------------------------------------------------------------------------
Project: cli-tutorial **Current Project**
	Conf Path: /builds/ghsc/esi/groundmotion-processing/docs/contents/tutorials/conf/cli
	Data Path: /builds/ghsc/esi/groundmotion-processing/docs/contents/tutorials/data/cli
--------------------------------------------------------------------------------
Compute Waveform Metrics
The compute_waveform_metrics subcommand computes waveform metrics (such as spectral accelerations) and adds them to the ASDF workspace file.
The waveform metrics that are computed are defined in the metrics section of the conf file.
The metrics are defined by intensity metric types (for example, spectral acceleration vs duration) and intensity measure component (how the instrument components are combined).
$ gmrecords compute_waveform_metrics
INFO 2026-07-18 22:56:50 | gmrecords._initialize: Logging level includes INFO.
INFO 2026-07-18 22:56:50 | gmrecords._initialize: PROJECTS_PATH: /builds/ghsc/esi/groundmotion-processing/docs/contents/tutorials/.gmprocess
INFO 2026-07-18 22:56:50 | compute_waveform_metrics.main: Running subcommand 'compute_waveform_metrics'
INFO 2026-07-18 22:56:50 | compute_waveform_metrics.main: Computing waveform metrics for event nc73291880 (1 of 1)...
INFO 2026-07-18 22:56:50 | compute_waveform_metrics._compute_event_waveform_metrics: Calculating waveform metrics for BK.BRIB.01.HN...
INFO 2026-07-18 22:56:50 | waveform_metric_collection.calculate_metrics: Calculating metrics for stream BK.BRIB.01.HN
INFO 2026-07-18 22:57:23 | compute_waveform_metrics._compute_event_waveform_metrics: Adding waveform metrics to workspace files with tag 'default'.
INFO 2026-07-18 22:57:23 | base._summarize_files_created: No new files created.
--------------------------------------------------------------------------------
Project: cli-tutorial **Current Project**
	Conf Path: /builds/ghsc/esi/groundmotion-processing/docs/contents/tutorials/conf/cli
	Data Path: /builds/ghsc/esi/groundmotion-processing/docs/contents/tutorials/data/cli
--------------------------------------------------------------------------------
Note
Waveform metrics will not be computed for stations that do not pass the quality checks.
Export Failure Tables
It is useful to summarize the reasons that records have failed the QA checks, and this information can be output in a spreadsheet using the export_failure_tables subcommand.
Unlike many of the other subcommands, the output combines the results in all project events and puts the result into the base project directory.
$ gmrecords export_failure_tables
INFO 2026-07-18 22:57:25 | gmrecords._initialize: Logging level includes INFO.
INFO 2026-07-18 22:57:25 | gmrecords._initialize: PROJECTS_PATH: /builds/ghsc/esi/groundmotion-processing/docs/contents/tutorials/.gmprocess
INFO 2026-07-18 22:57:25 | export_failure_tables.main: Running subcommand 'export_failure_tables'
INFO 2026-07-18 22:57:25 | export_failure_tables.main: Creating failure tables for event nc73291880 (1 of 1)...
INFO 2026-07-18 22:57:26 | base._summarize_files_created: The following files have been created:
INFO 2026-07-18 22:57:26 | base._summarize_files_created: File type: Failure table
INFO 2026-07-18 22:57:26 | base._summarize_files_created: 	/builds/ghsc/esi/groundmotion-processing/docs/contents/tutorials/data/cli/nc73291880/cli-tutorial_default_failure_reasons_short.csv
INFO 2026-07-18 22:57:26 | base._summarize_files_created: File type: Complete failures
INFO 2026-07-18 22:57:26 | base._summarize_files_created: 	/builds/ghsc/esi/groundmotion-processing/docs/contents/tutorials/data/cli/cli-tutorial_default_complete_failures.csv
--------------------------------------------------------------------------------
Project: cli-tutorial **Current Project**
	Conf Path: /builds/ghsc/esi/groundmotion-processing/docs/contents/tutorials/conf/cli
	Data Path: /builds/ghsc/esi/groundmotion-processing/docs/contents/tutorials/data/cli
--------------------------------------------------------------------------------
Export Metric Tables
Although the metrics can be accessed directly from the ASDF file, it is often convenient to save the metrics (both station and waveform) into a “flatfile” where each row corresponds to a single record.
$ gmrecords export_metric_tables
INFO 2026-07-18 22:57:28 | gmrecords._initialize: Logging level includes INFO.
INFO 2026-07-18 22:57:28 | gmrecords._initialize: PROJECTS_PATH: /builds/ghsc/esi/groundmotion-processing/docs/contents/tutorials/.gmprocess
INFO 2026-07-18 22:57:28 | export_metric_tables.main: Running subcommand 'export_metric_tables'
INFO 2026-07-18 22:57:28 | export_metric_tables.main: Creating tables for event nc73291880 (1 of 1)...
INFO 2026-07-18 22:57:31 | base._summarize_files_created: The following files have been created:
INFO 2026-07-18 22:57:31 | base._summarize_files_created: File type: Metric tables
INFO 2026-07-18 22:57:31 | base._summarize_files_created: 	/builds/ghsc/esi/groundmotion-processing/docs/contents/tutorials/data/cli/cli-tutorial_default_events.csv
INFO 2026-07-18 22:57:31 | base._summarize_files_created: 	/builds/ghsc/esi/groundmotion-processing/docs/contents/tutorials/data/cli/cli-tutorial_default_metrics_channels(component=h1).csv
INFO 2026-07-18 22:57:31 | base._summarize_files_created: 	/builds/ghsc/esi/groundmotion-processing/docs/contents/tutorials/data/cli/cli-tutorial_default_metrics_quadraticmean().csv
INFO 2026-07-18 22:57:31 | base._summarize_files_created: 	/builds/ghsc/esi/groundmotion-processing/docs/contents/tutorials/data/cli/cli-tutorial_default_metrics_channels(component=h2).csv
INFO 2026-07-18 22:57:31 | base._summarize_files_created: 	/builds/ghsc/esi/groundmotion-processing/docs/contents/tutorials/data/cli/cli-tutorial_default_metrics_geometricmean().csv
INFO 2026-07-18 22:57:31 | base._summarize_files_created: 	/builds/ghsc/esi/groundmotion-processing/docs/contents/tutorials/data/cli/cli-tutorial_default_metrics_channels(component=z).csv
INFO 2026-07-18 22:57:31 | base._summarize_files_created: 	/builds/ghsc/esi/groundmotion-processing/docs/contents/tutorials/data/cli/cli-tutorial_default_metrics_rotd(percentile=50.0).csv
INFO 2026-07-18 22:57:31 | base._summarize_files_created: 	/builds/ghsc/esi/groundmotion-processing/docs/contents/tutorials/data/cli/cli-tutorial_default_metrics_channels(component=h1)_README.csv
INFO 2026-07-18 22:57:31 | base._summarize_files_created: 	/builds/ghsc/esi/groundmotion-processing/docs/contents/tutorials/data/cli/cli-tutorial_default_metrics_quadraticmean()_README.csv
INFO 2026-07-18 22:57:31 | base._summarize_files_created: 	/builds/ghsc/esi/groundmotion-processing/docs/contents/tutorials/data/cli/cli-tutorial_default_metrics_channels(component=h2)_README.csv
INFO 2026-07-18 22:57:31 | base._summarize_files_created: 	/builds/ghsc/esi/groundmotion-processing/docs/contents/tutorials/data/cli/cli-tutorial_default_metrics_geometricmean()_README.csv
INFO 2026-07-18 22:57:31 | base._summarize_files_created: 	/builds/ghsc/esi/groundmotion-processing/docs/contents/tutorials/data/cli/cli-tutorial_default_metrics_channels(component=z)_README.csv
INFO 2026-07-18 22:57:31 | base._summarize_files_created: 	/builds/ghsc/esi/groundmotion-processing/docs/contents/tutorials/data/cli/cli-tutorial_default_metrics_rotd(percentile=50.0)_README.csv
INFO 2026-07-18 22:57:31 | base._summarize_files_created: 	/builds/ghsc/esi/groundmotion-processing/docs/contents/tutorials/data/cli/cli-tutorial_default_fit_spectra_parameters.csv
INFO 2026-07-18 22:57:31 | base._summarize_files_created: 	/builds/ghsc/esi/groundmotion-processing/docs/contents/tutorials/data/cli/cli-tutorial_default_fit_spectra_parameters_README.csv
INFO 2026-07-18 22:57:31 | base._summarize_files_created: 	/builds/ghsc/esi/groundmotion-processing/docs/contents/tutorials/data/cli/cli-tutorial_default_snr.csv
INFO 2026-07-18 22:57:31 | base._summarize_files_created: 	/builds/ghsc/esi/groundmotion-processing/docs/contents/tutorials/data/cli/cli-tutorial_default_snr_README.csv
--------------------------------------------------------------------------------
Project: cli-tutorial **Current Project**
	Conf Path: /builds/ghsc/esi/groundmotion-processing/docs/contents/tutorials/conf/cli
	Data Path: /builds/ghsc/esi/groundmotion-processing/docs/contents/tutorials/data/cli
--------------------------------------------------------------------------------
Note that the metric tables are organized into separate files for each intensity measure component (i.e., “IMT”).
Export Provenance Tables
As with the metric and failure tables, you can also output tables summarizing the provenance information.
$ gmrecords export_provenance_tables
INFO 2026-07-18 22:57:34 | gmrecords._initialize: Logging level includes INFO.
INFO 2026-07-18 22:57:34 | gmrecords._initialize: PROJECTS_PATH: /builds/ghsc/esi/groundmotion-processing/docs/contents/tutorials/.gmprocess
INFO 2026-07-18 22:57:34 | export_provenance_tables.main: Running subcommand 'export_provenance_tables'
INFO 2026-07-18 22:57:34 | export_provenance_tables.main: Creating provenance tables for event nc73291880 (1 of 1)...
INFO 2026-07-18 22:57:35 | base._summarize_files_created: The following files have been created:
INFO 2026-07-18 22:57:35 | base._summarize_files_created: File type: Provenance
INFO 2026-07-18 22:57:35 | base._summarize_files_created: 	/builds/ghsc/esi/groundmotion-processing/docs/contents/tutorials/data/cli/nc73291880/cli-tutorial_default_provenance.csv
--------------------------------------------------------------------------------
Project: cli-tutorial **Current Project**
	Conf Path: /builds/ghsc/esi/groundmotion-processing/docs/contents/tutorials/conf/cli
	Data Path: /builds/ghsc/esi/groundmotion-processing/docs/contents/tutorials/data/cli
--------------------------------------------------------------------------------
Generate Regression Plot
Although the report created by the generate_report subcommand is helpful for checking for some possible processing problems, it cannot identify outliers that may be due to incorrect metadata (such as the gain).
This type of issue is relatively common, and can sometimes be identified by plotting the peak ground acceleration as a function of distance.
Important
You must run the export_metric_tables before running generate_regression_plot.
$ gmrecords generate_regression_plot
INFO 2026-07-18 22:57:37 | gmrecords._initialize: Logging level includes INFO.
INFO 2026-07-18 22:57:37 | gmrecords._initialize: PROJECTS_PATH: /builds/ghsc/esi/groundmotion-processing/docs/contents/tutorials/.gmprocess
INFO 2026-07-18 22:57:37 | generate_regression_plot.main: Running subcommand 'generate_regression_plot'
INFO 2026-07-18 22:57:38 | base._summarize_files_created: The following files have been created:
INFO 2026-07-18 22:57:38 | base._summarize_files_created: File type: Multi-event regression plot
INFO 2026-07-18 22:57:38 | base._summarize_files_created: 	/builds/ghsc/esi/groundmotion-processing/docs/contents/tutorials/data/cli/regression_rotd(percentile=50.0)_PGA.png
--------------------------------------------------------------------------------
Project: cli-tutorial **Current Project**
	Conf Path: /builds/ghsc/esi/groundmotion-processing/docs/contents/tutorials/conf/cli
	Data Path: /builds/ghsc/esi/groundmotion-processing/docs/contents/tutorials/data/cli
--------------------------------------------------------------------------------
An example is given below, but for this plot we re-ran the above commands with a larger maximum station radius (0.8 degrees) to make the plot look a little bit more interesting than it looks for a small dataset.
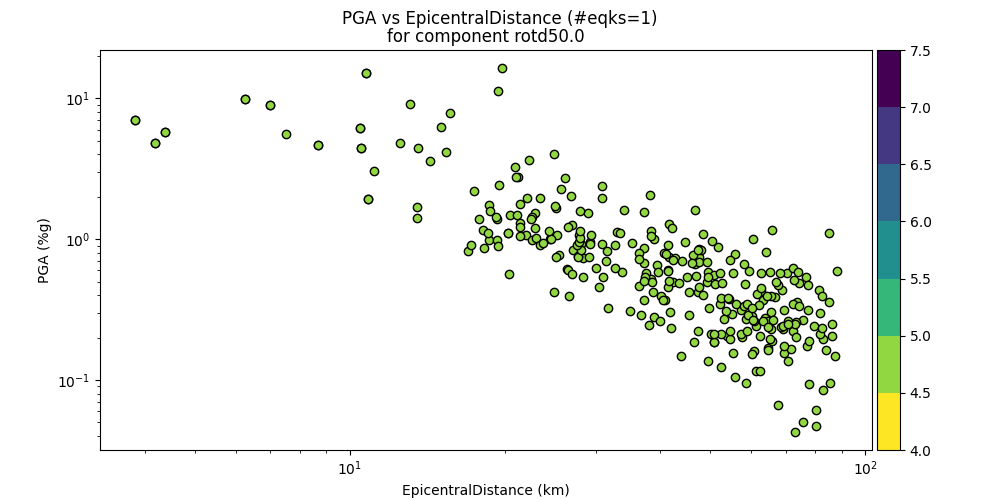
Peak ground acceleration versus epicentral distance for expanded dataset (max station distance of 0.8 degrees).
Station Map
The generate_station_maps command makes an interactive HTML map that can be opened in a browser.
$ gmrecords generate_station_maps
INFO 2026-07-18 22:57:40 | gmrecords._initialize: Logging level includes INFO.
INFO 2026-07-18 22:57:40 | gmrecords._initialize: PROJECTS_PATH: /builds/ghsc/esi/groundmotion-processing/docs/contents/tutorials/.gmprocess
INFO 2026-07-18 22:57:40 | generate_station_maps.main: Running subcommand 'generate_station_maps'
INFO 2026-07-18 22:57:40 | generate_station_maps.main: Generating station maps for event nc73291880 (1 of 1)...
INFO 2026-07-18 22:57:41 | base._summarize_files_created: The following files have been created:
INFO 2026-07-18 22:57:41 | base._summarize_files_created: File type: Station map
INFO 2026-07-18 22:57:41 | base._summarize_files_created: 	/builds/ghsc/esi/groundmotion-processing/docs/contents/tutorials/data/cli/nc73291880/stations_map.html
--------------------------------------------------------------------------------
Project: cli-tutorial **Current Project**
	Conf Path: /builds/ghsc/esi/groundmotion-processing/docs/contents/tutorials/conf/cli
	Data Path: /builds/ghsc/esi/groundmotion-processing/docs/contents/tutorials/data/cli
--------------------------------------------------------------------------------
Example interactive station map. #