Plots
The plots directory contains all of the plots regarding the actual simulated runout, broken up by region, as well as some synthesis plots.
Overview plots
region-overview.png: An overview plot showing the region numbering, area of analysis, and fire perimeter.
compare_areas.png: An overview plot showing the relation between input parameters and inundated area.
compare_volumes/sed_vol.png: An overview plot showing the relation between input parameters and sediment volume.
compare_volumes/wat_vol.png: An overview plot showing the relation between input parameters and water volume.
compare_volumes/total_vol.png: An overview plot showing the relation between input parameters and total volume.
Exposure plots
For each region (X in the filenames below), and for the entire fire, figures are made that summarize the exposure of buildings, roads, and crossings to postfire debris-flow inundation. These plots are located in a subdirectory called ‘exposure’.
exposure_basin_X.png: A plot showing the relation between the \(I_{15}\) and number of buildings, roads, and crossings within an active basin.
exposure_boxplots_X.png: A plot showing the distribution of exposed buildings, roads, and crossings as a function of of \(I_{15}\). The values the make up each distribution are derived from a range of minimum debris-flow simulation index (DFSI).
exposure_cumulative_X.png: A plot showing the cumulative distribution of exposed buildings, roads, and crossings as the minimum DFSI value increases. This plot and exposure_boxplots_X.png depict the same information two different ways.
Region plots
One directory is made for each region. Additionally, there is a directory for the entire fire (“ALL”) and any user-defined regions specifified within the config file.
Each of the region directories contains the following plots:
region_X-expected-depth_I15-Y
For each rainfall intensity Y, this plot shows the “expected_max_h” layer from results/synthesis/I15_Y-results.nc, which represents the mean of the maximum depths of inundation for all simulations at rainfall intensity Y. The figure saved is bounded by the bounding box of region X, so that the runout in region X is the focus.
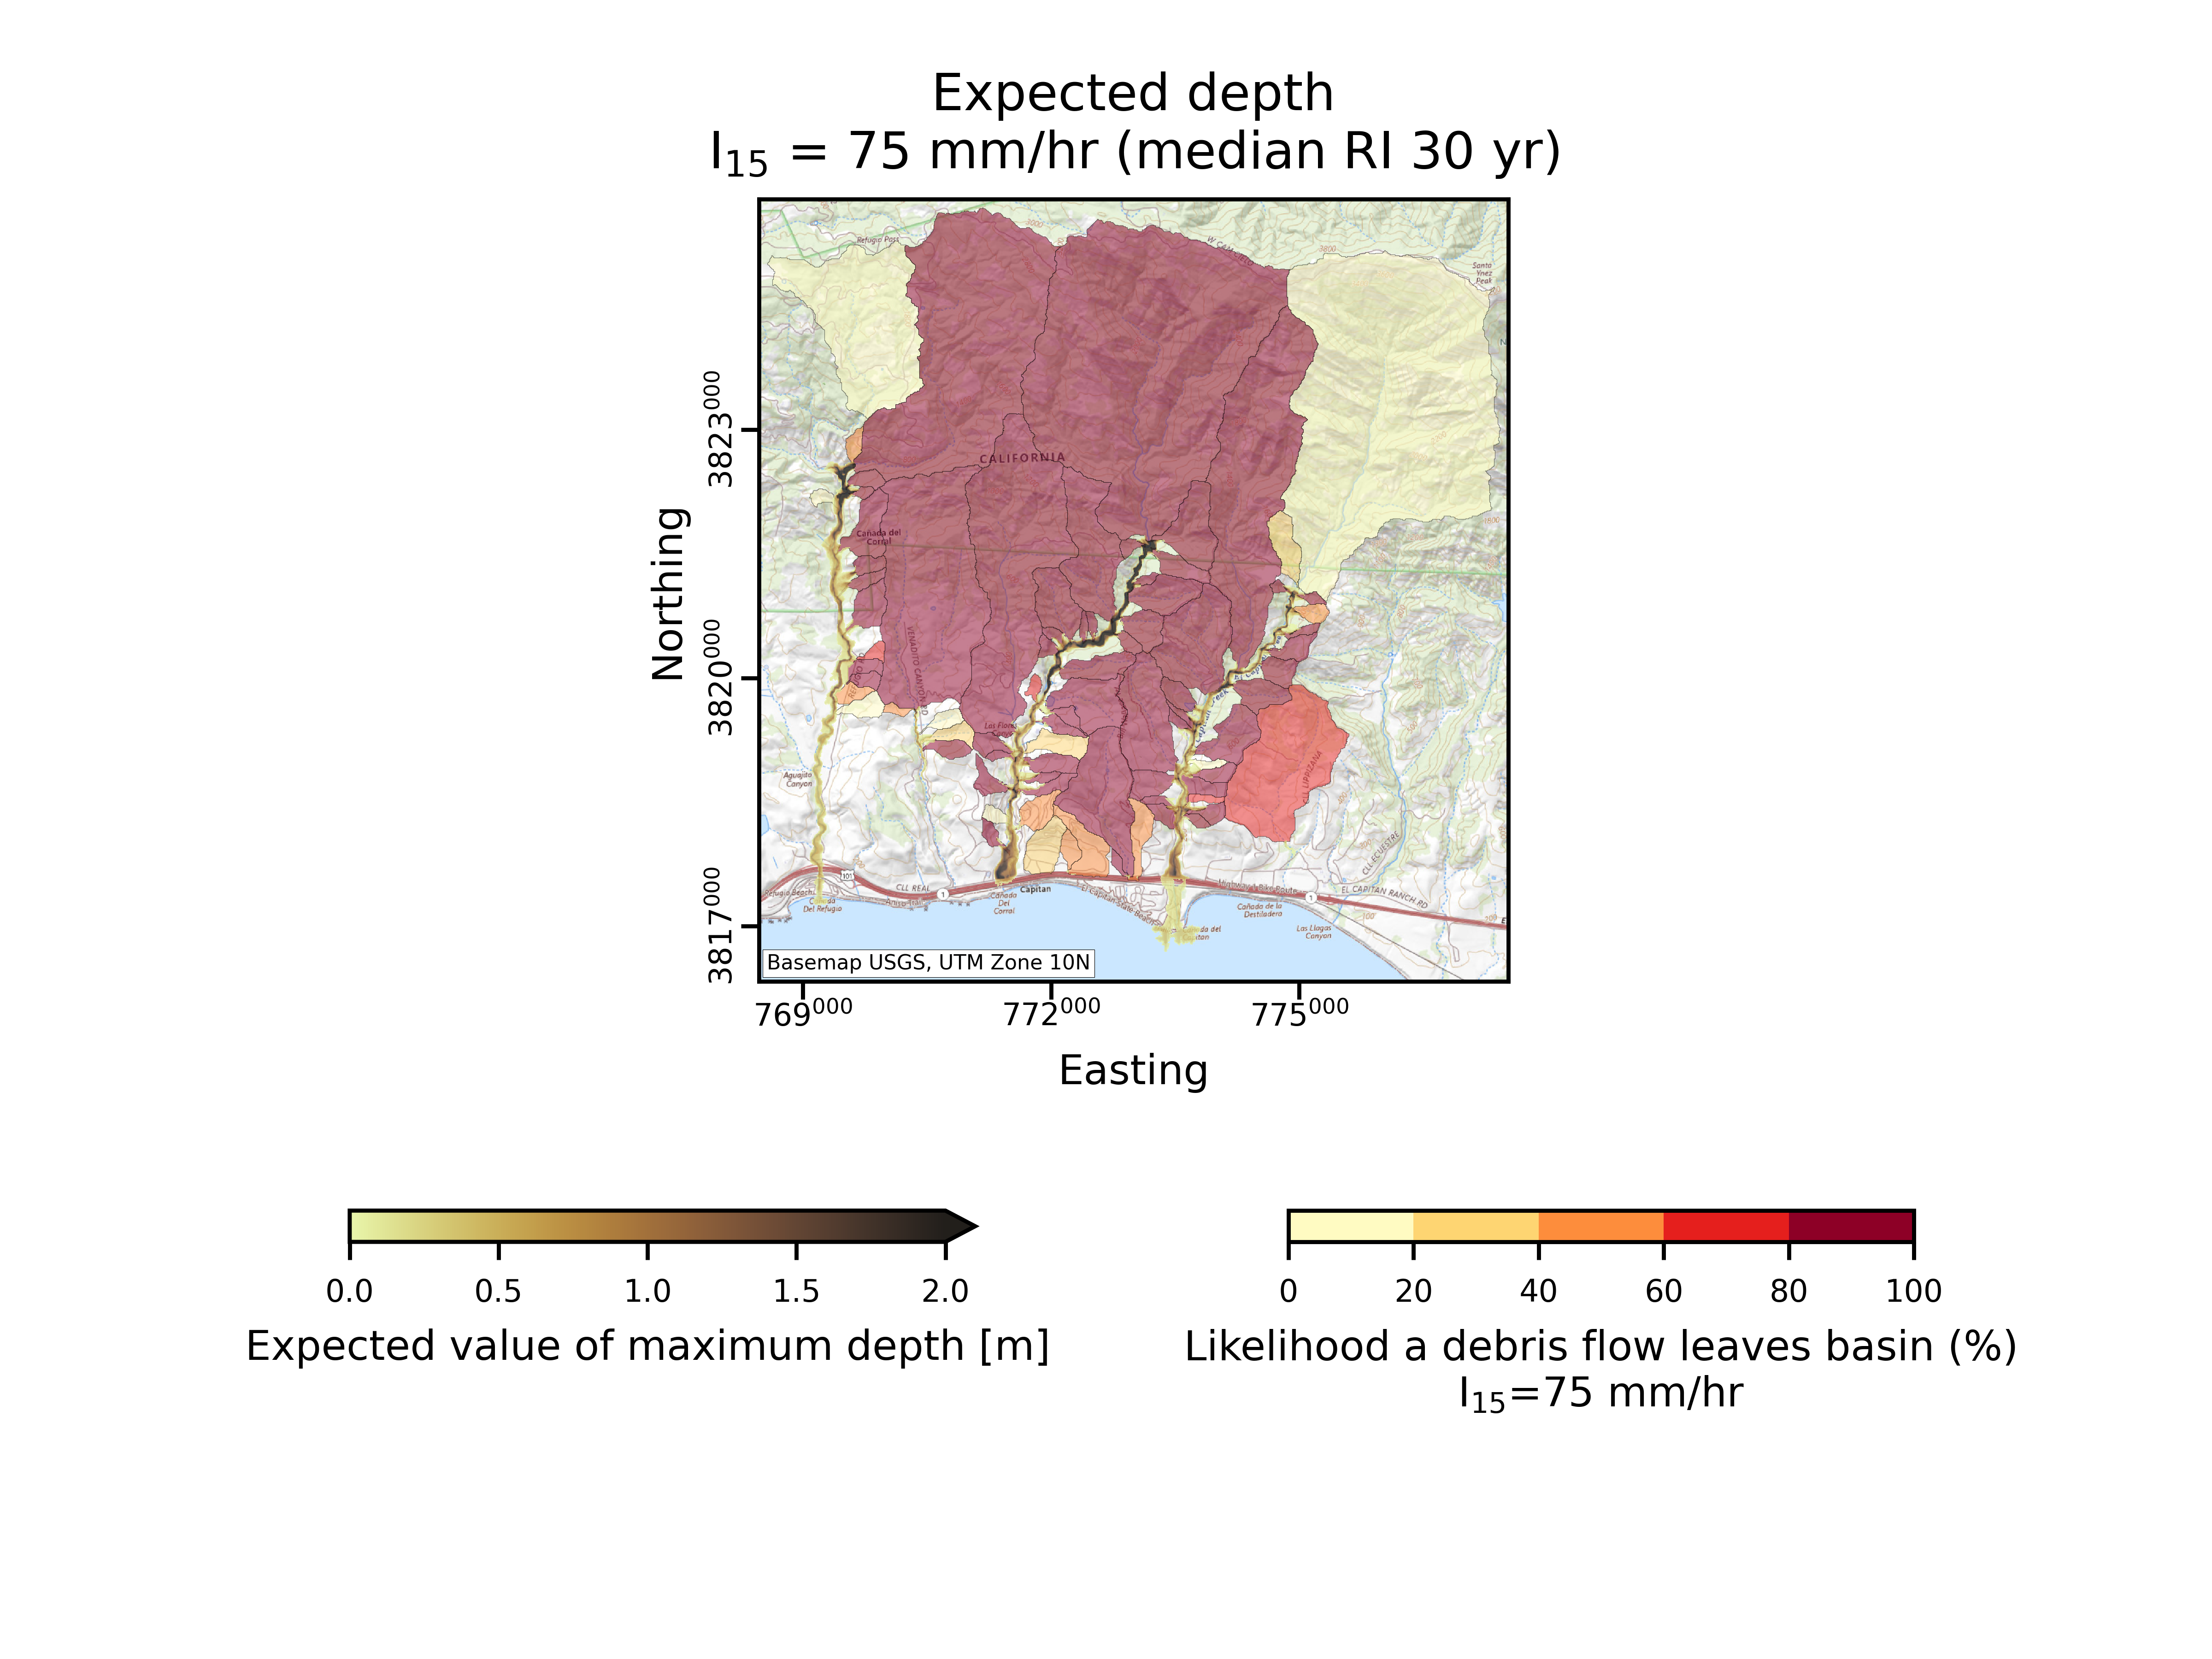
Fig. 1 An example of what an expected depth plot looks like (based on the 2016 Sherpa Fire).
region_X-expected-hss_I15-Y
For each rainfall intensity Y, this plot shows the “expected_max_hss” layer from results/synthesis/I15_Y-results.nc, which represents the mean of the maximum value of momentum flux for all simulations at rainfall intensity Y. The figure saved is bounded by the bounding box of region X, so that the runout in region X is the focus.
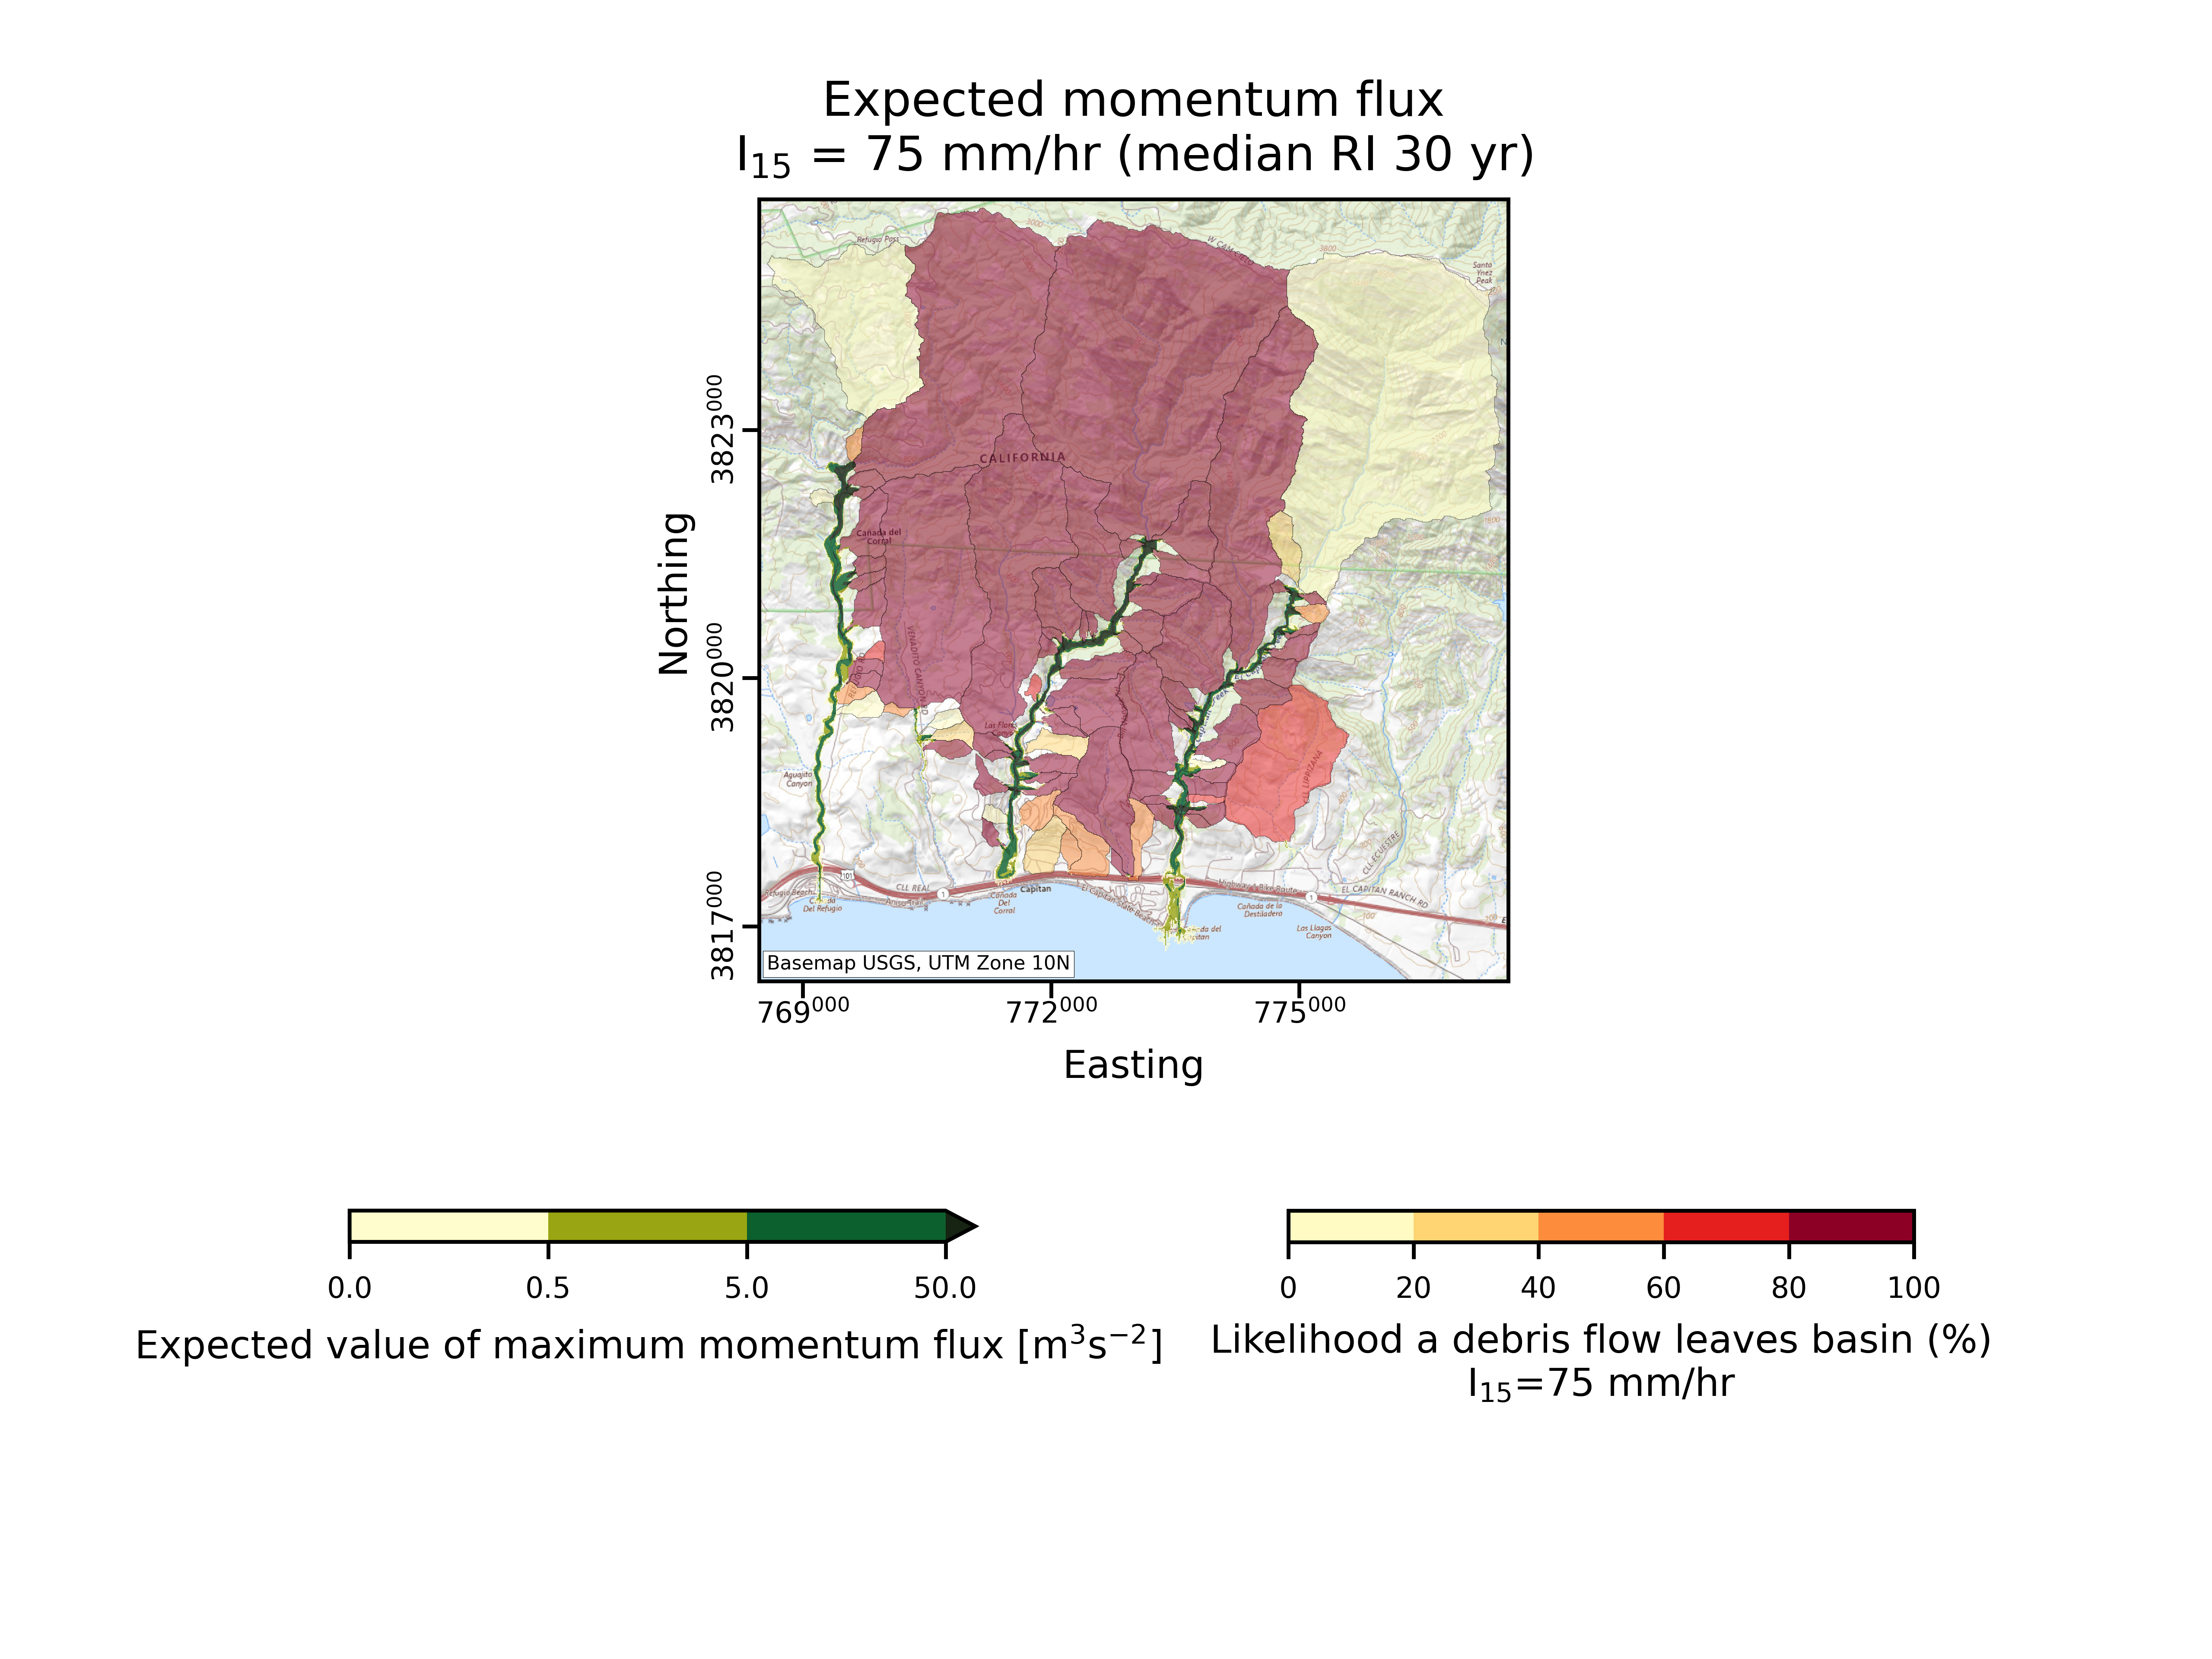
Fig. 2 An example of what an expected hss plot looks like (based on the 2016 Sherpa Fire).
region_X-median_depth_I15-Y
For each rainfall intensity Y, this plot shows the “median_max_h” layer from results/synthesis/I15_Y-results.nc, which represents the median of the maximum depths of inundation for all simulations at rainfall intensity Y. The figure saved is bounded by the bounding box of region X, so that the runout in region X is the focus.
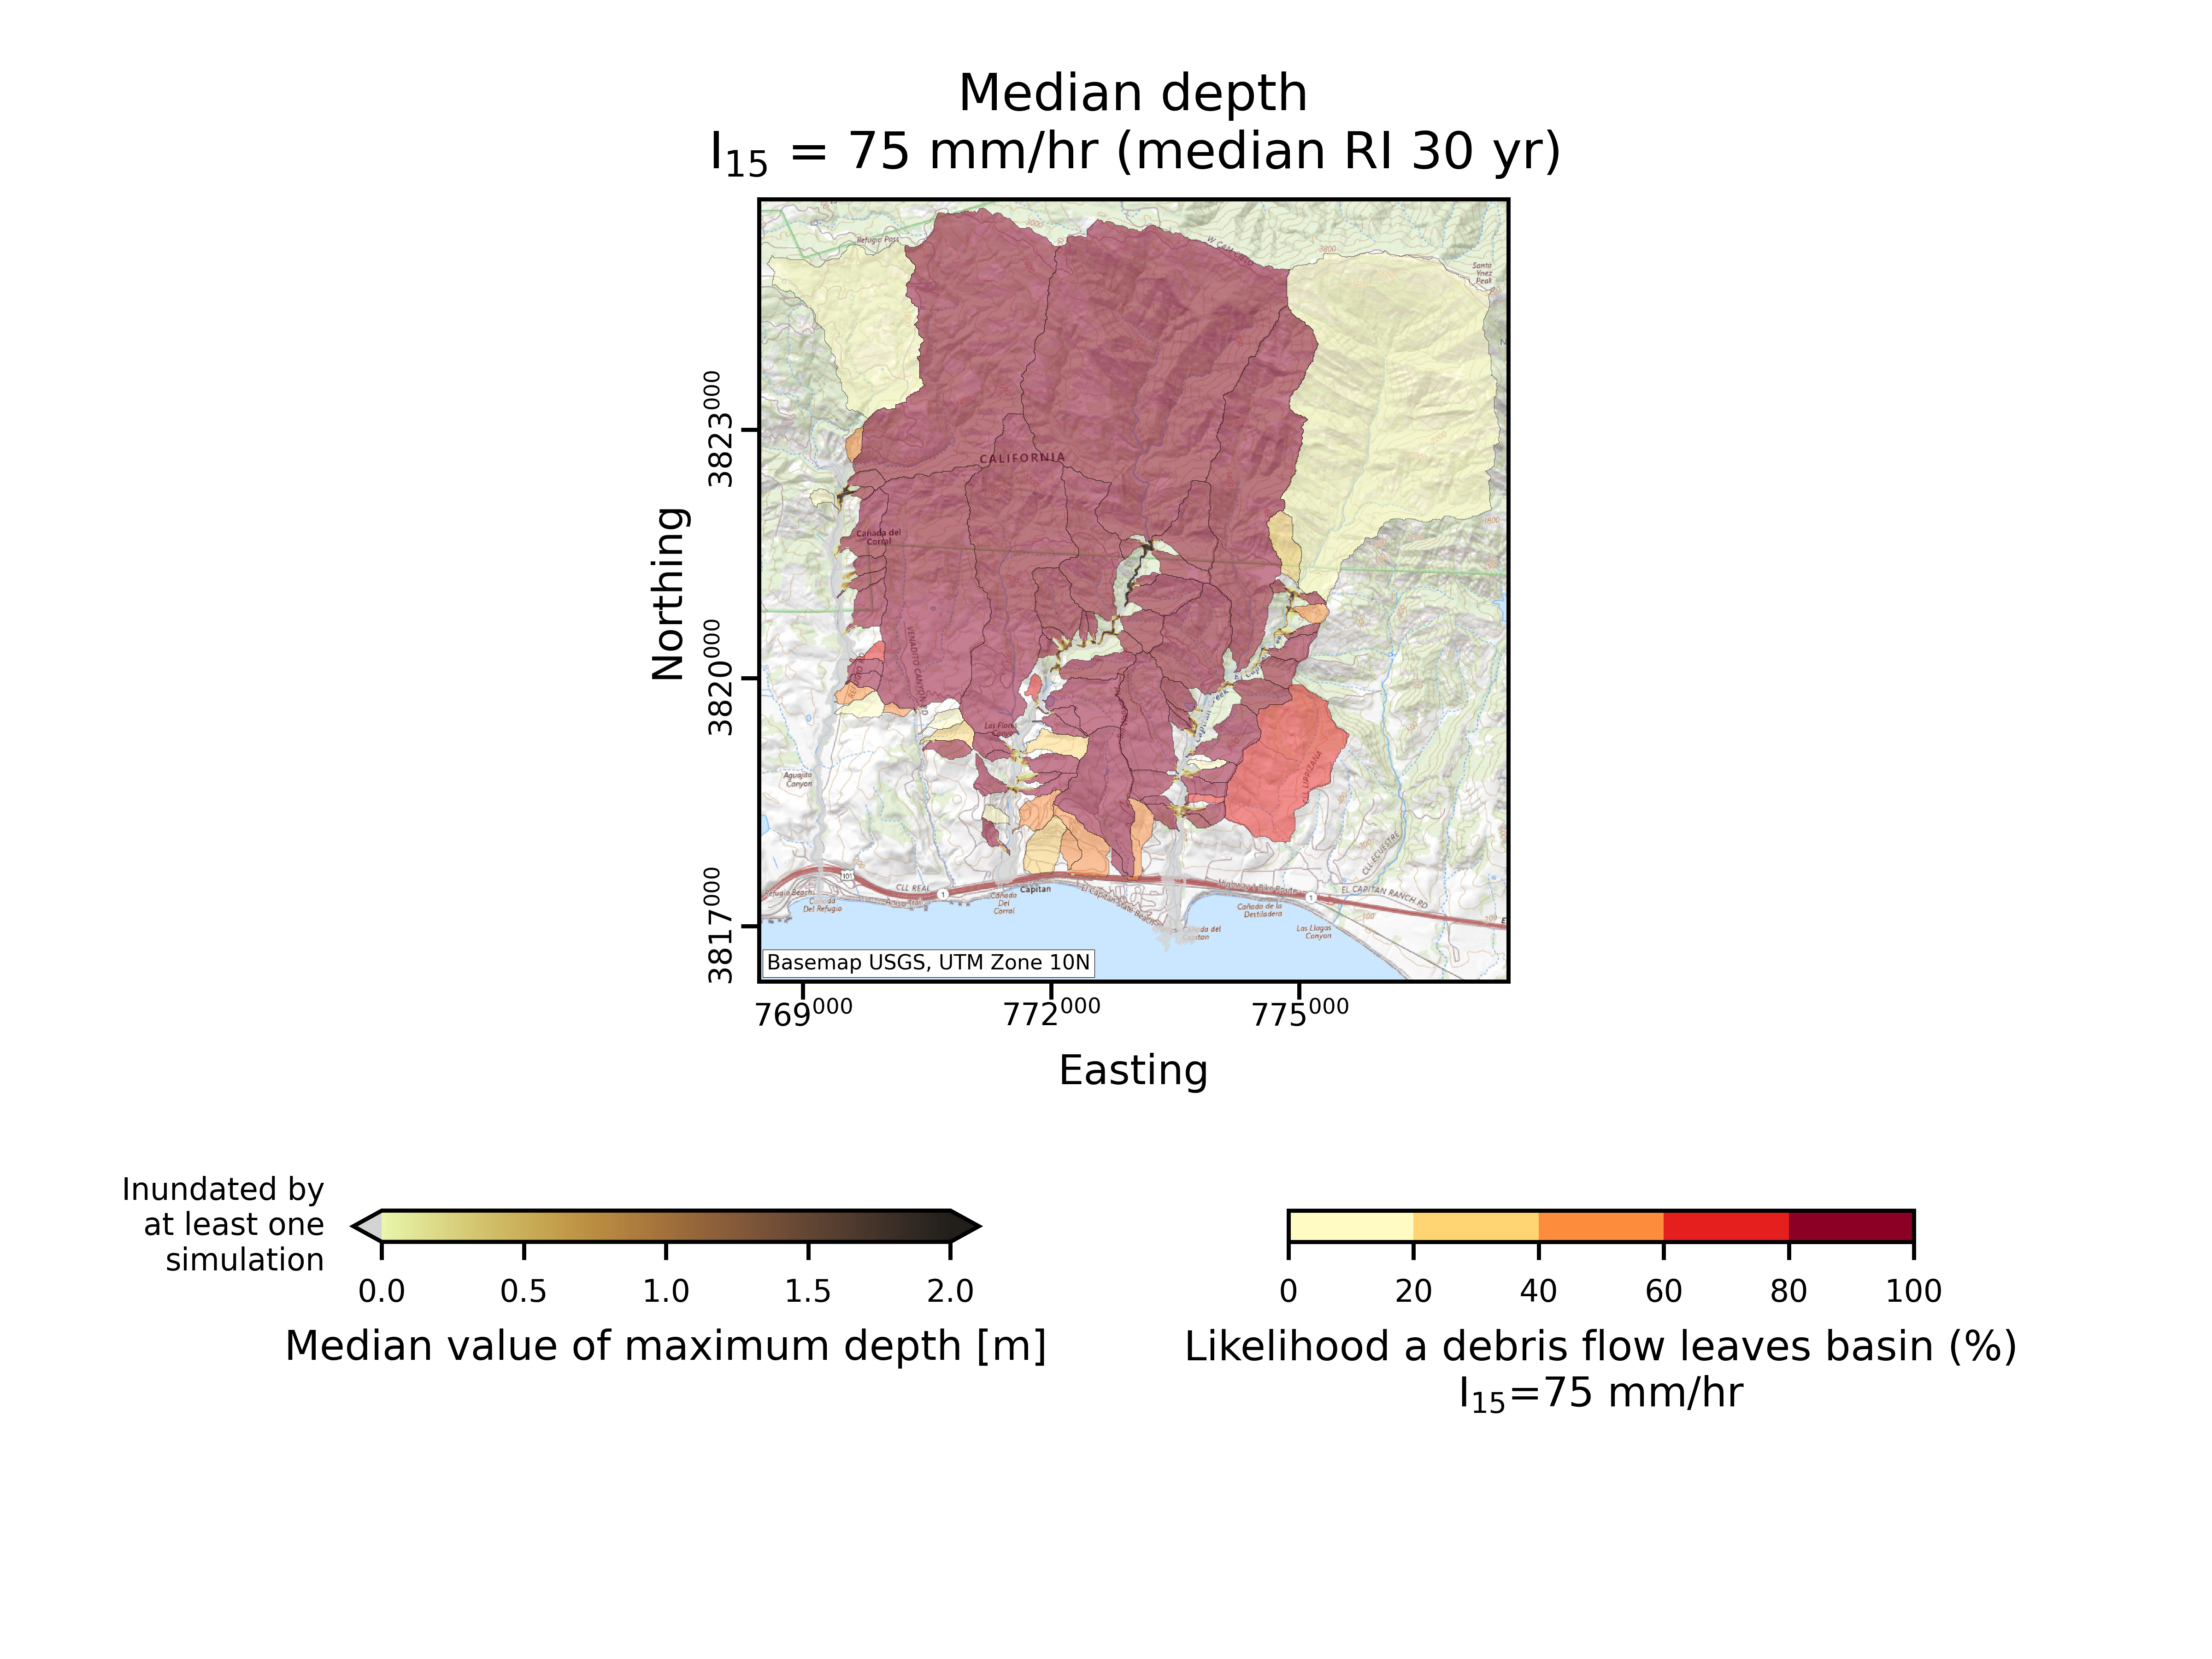
Fig. 3 An example of what an expected depth plot looks like (based on the 2016 Sherpa Fire).
region_X-median-hss_I15-Y
For each rainfall intensity Y, this plot shows the “median_max_hss” layer from results/synthesis/I15_Y-results.nc, which represents the median of the maximum value of momentum flux for all simulations at rainfall intensity Y. The figure saved is bounded by the bounding box of region X, so that the runout in region X is the focus.
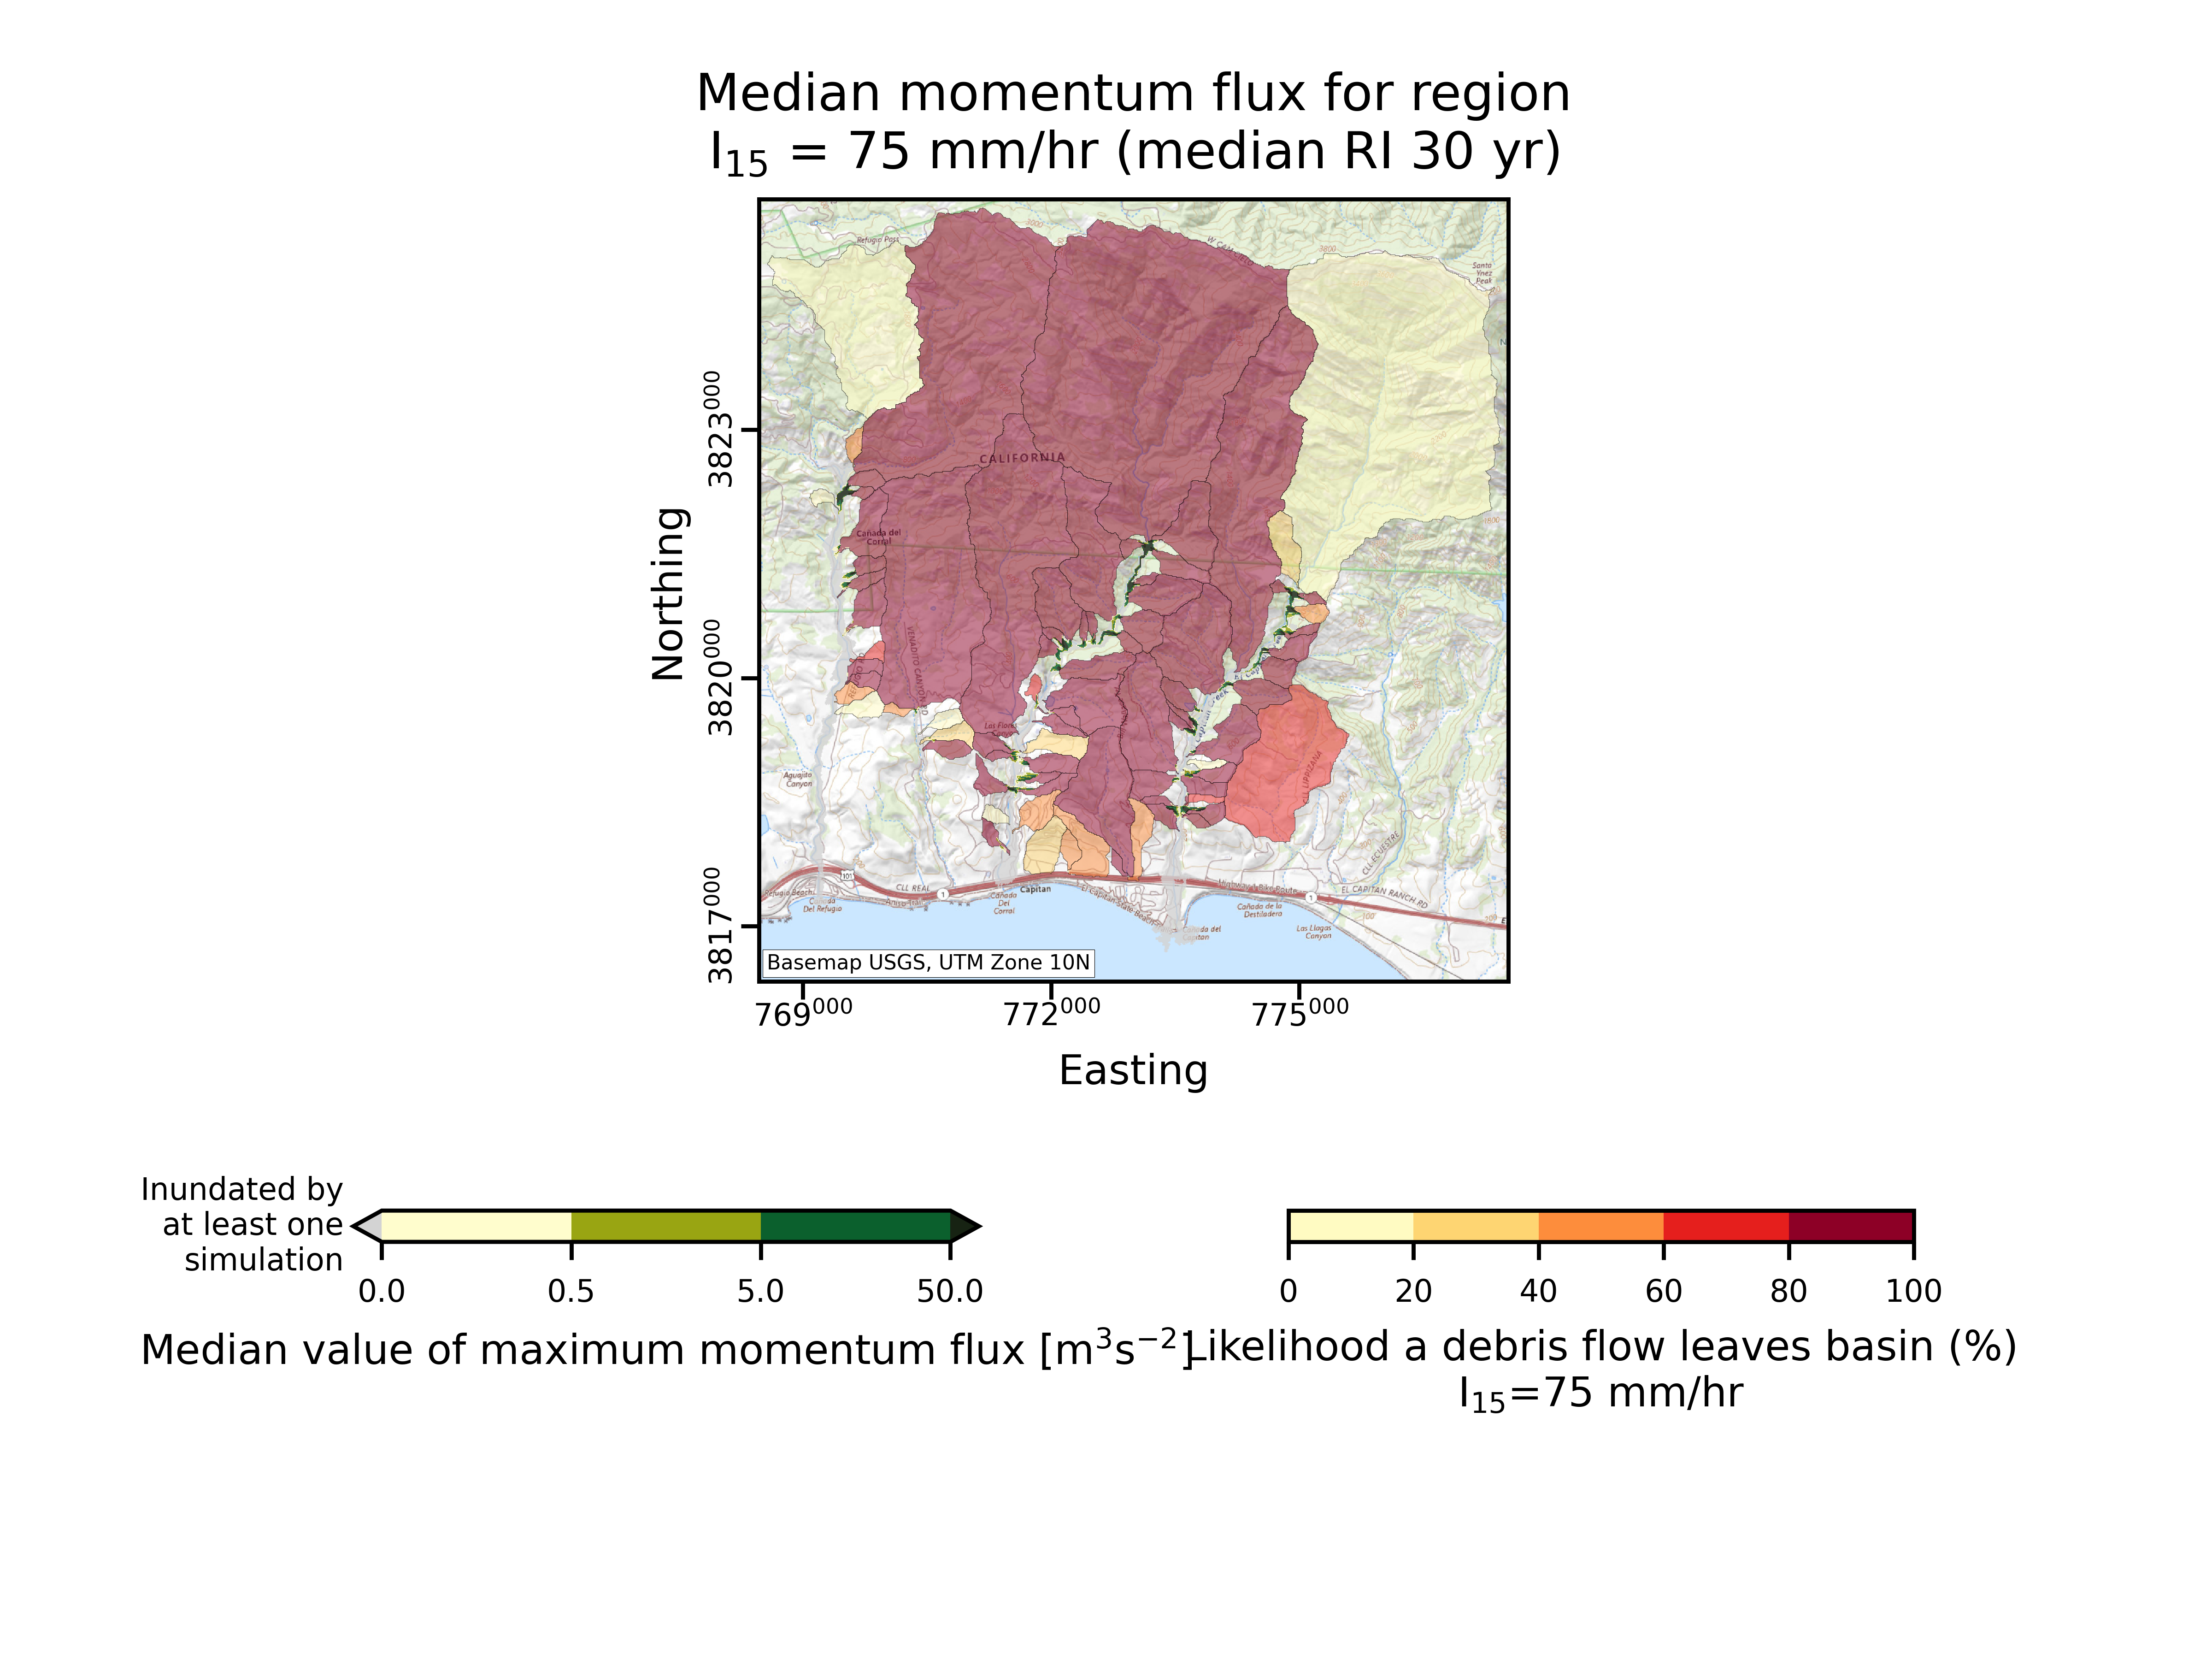
Fig. 4 An example of what an median hss plot looks like (based on the 2016 Sherpa Fire).
region_X-simulation_index-I15_Y
For each rainfall intensity Y, this plot shows the debris-flow simulation index. The figure saved is bounded by the bounding box of region X, so that the hazard levels in region X is the focus.
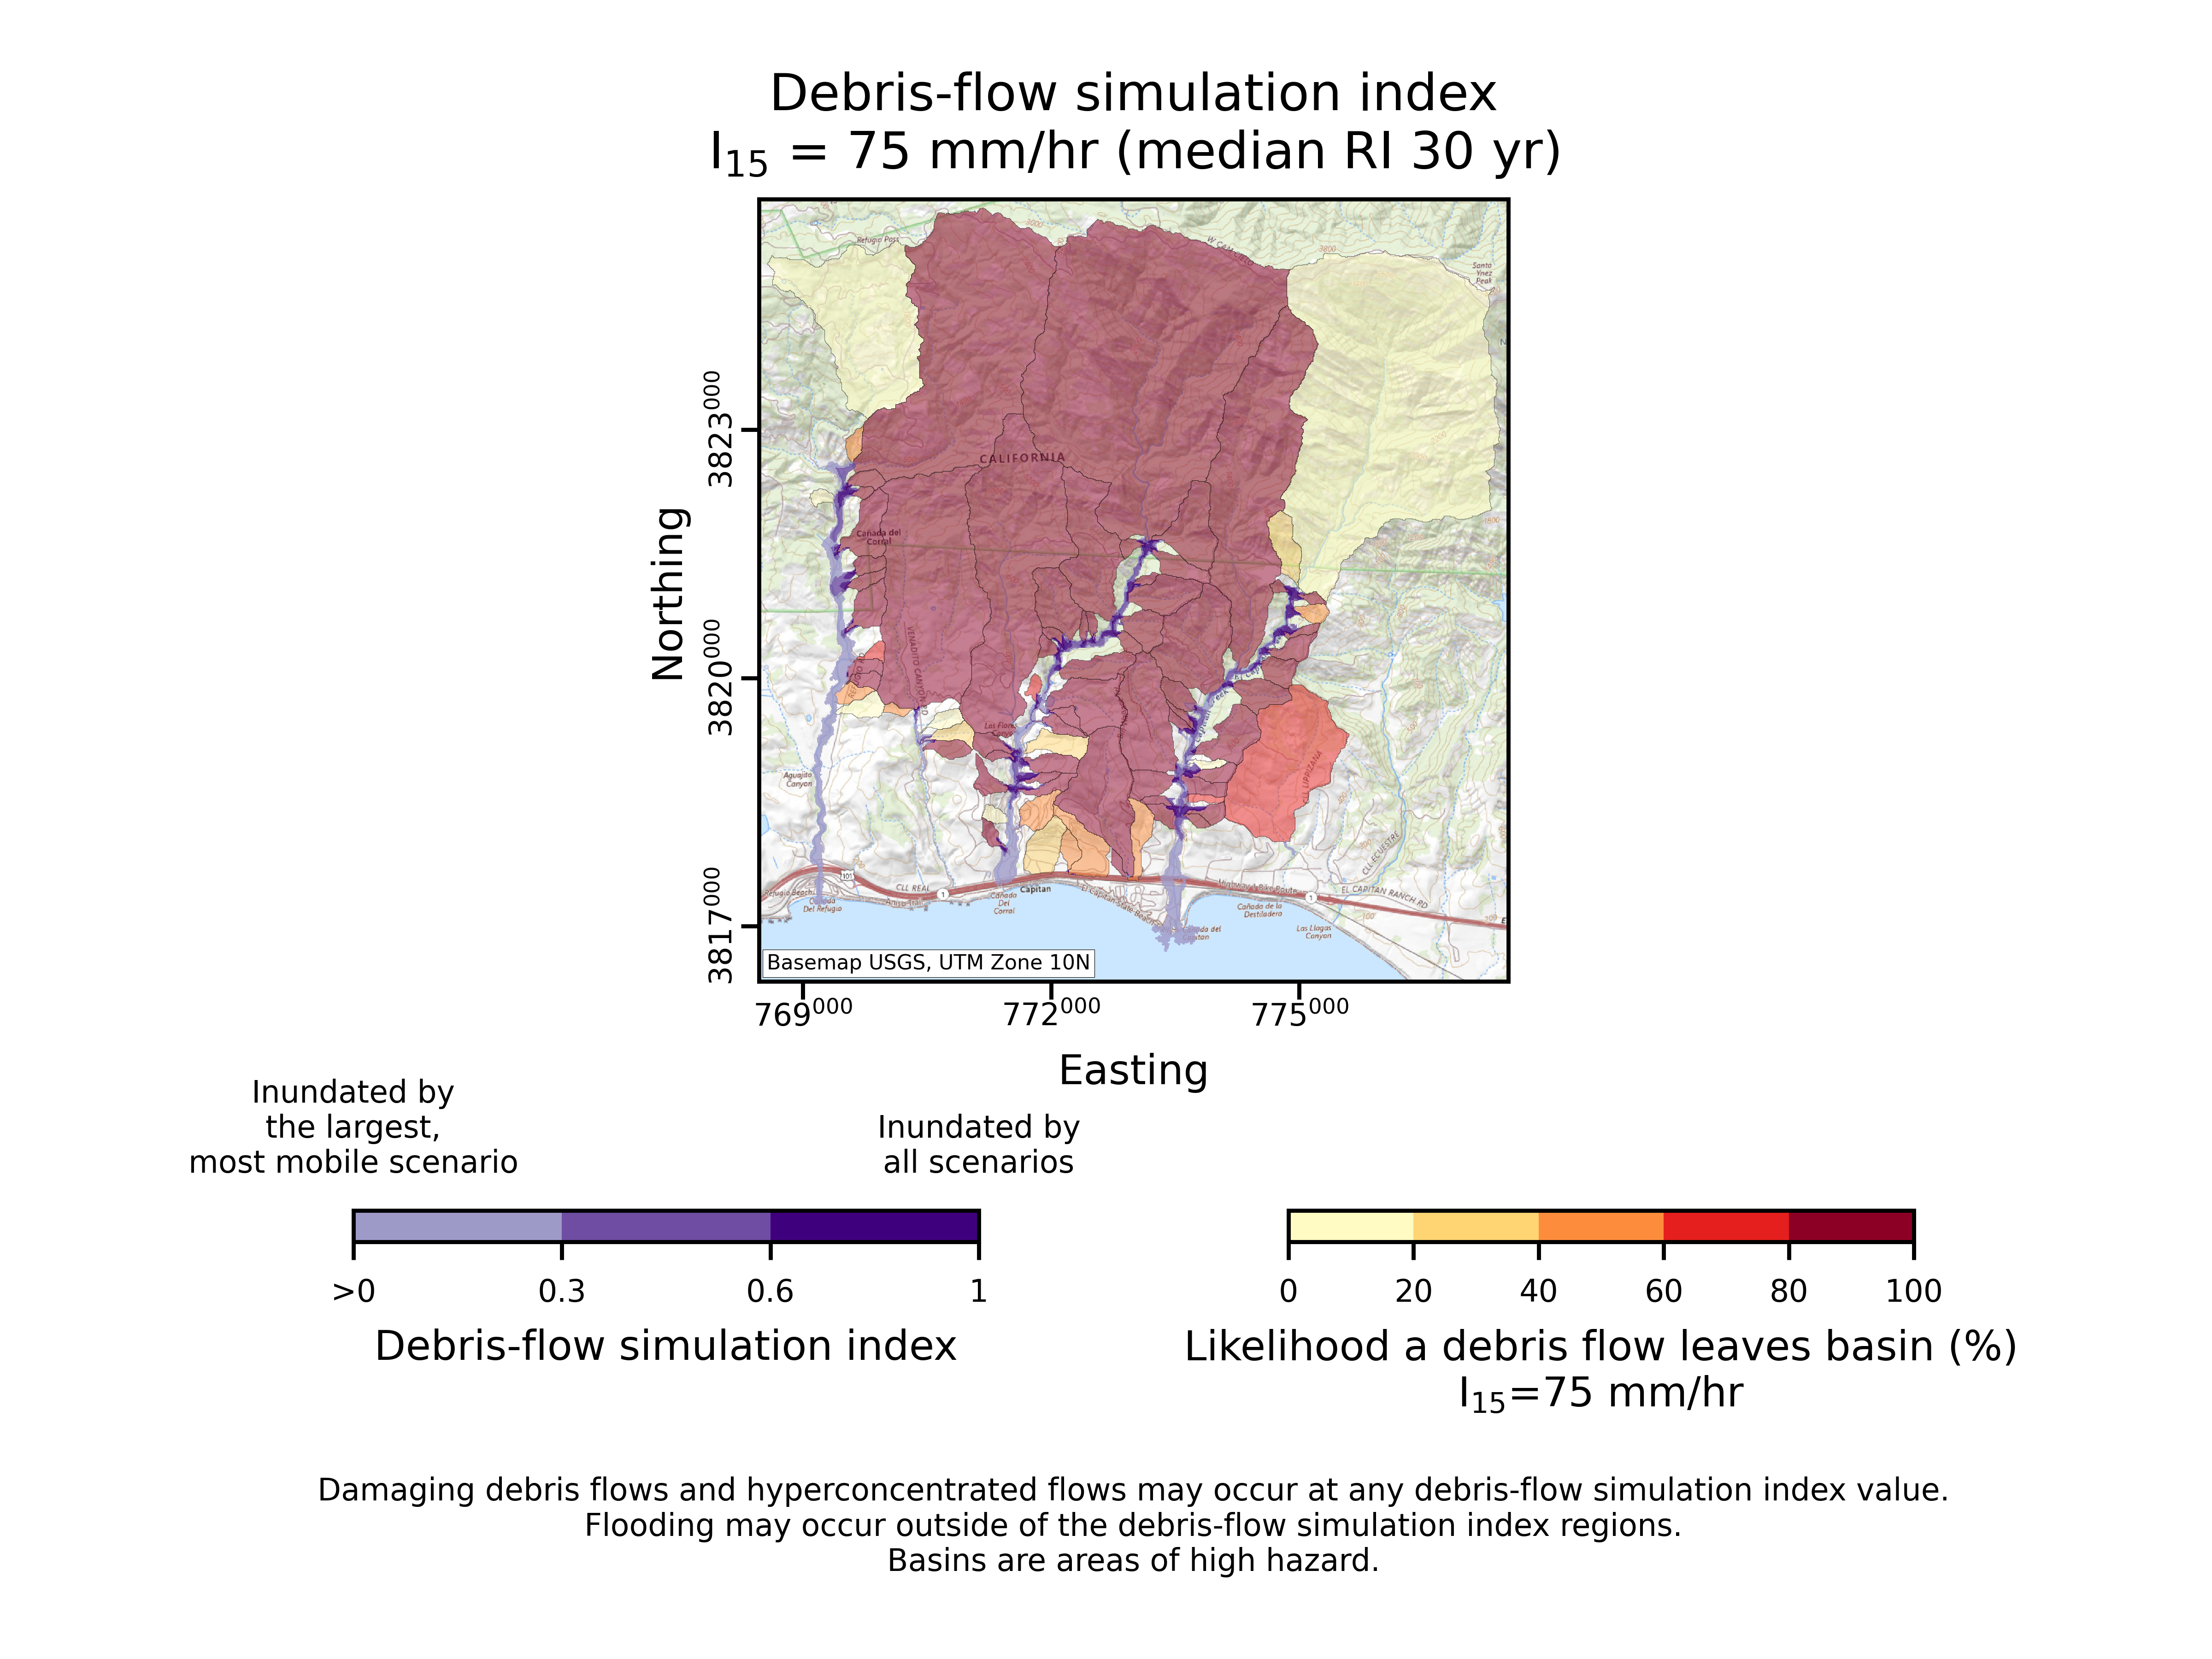
Fig. 5 An example of what a hazard index plot looks like (based on the 2016 Sherpa Fire).
region_X-inund_extent-DFSI_Y
For each debris-flow simulation index threshold Y, this plot shows the extent of the inundation that reaches that simulation index at each rainfall intensity. Within the legend for the I15 values, the recurrence interval for a rainstorm of that intensity is placed as well for reference. The figure saved is bounded by the bounding box of region X, so that the hazard levels in region X is the focus.
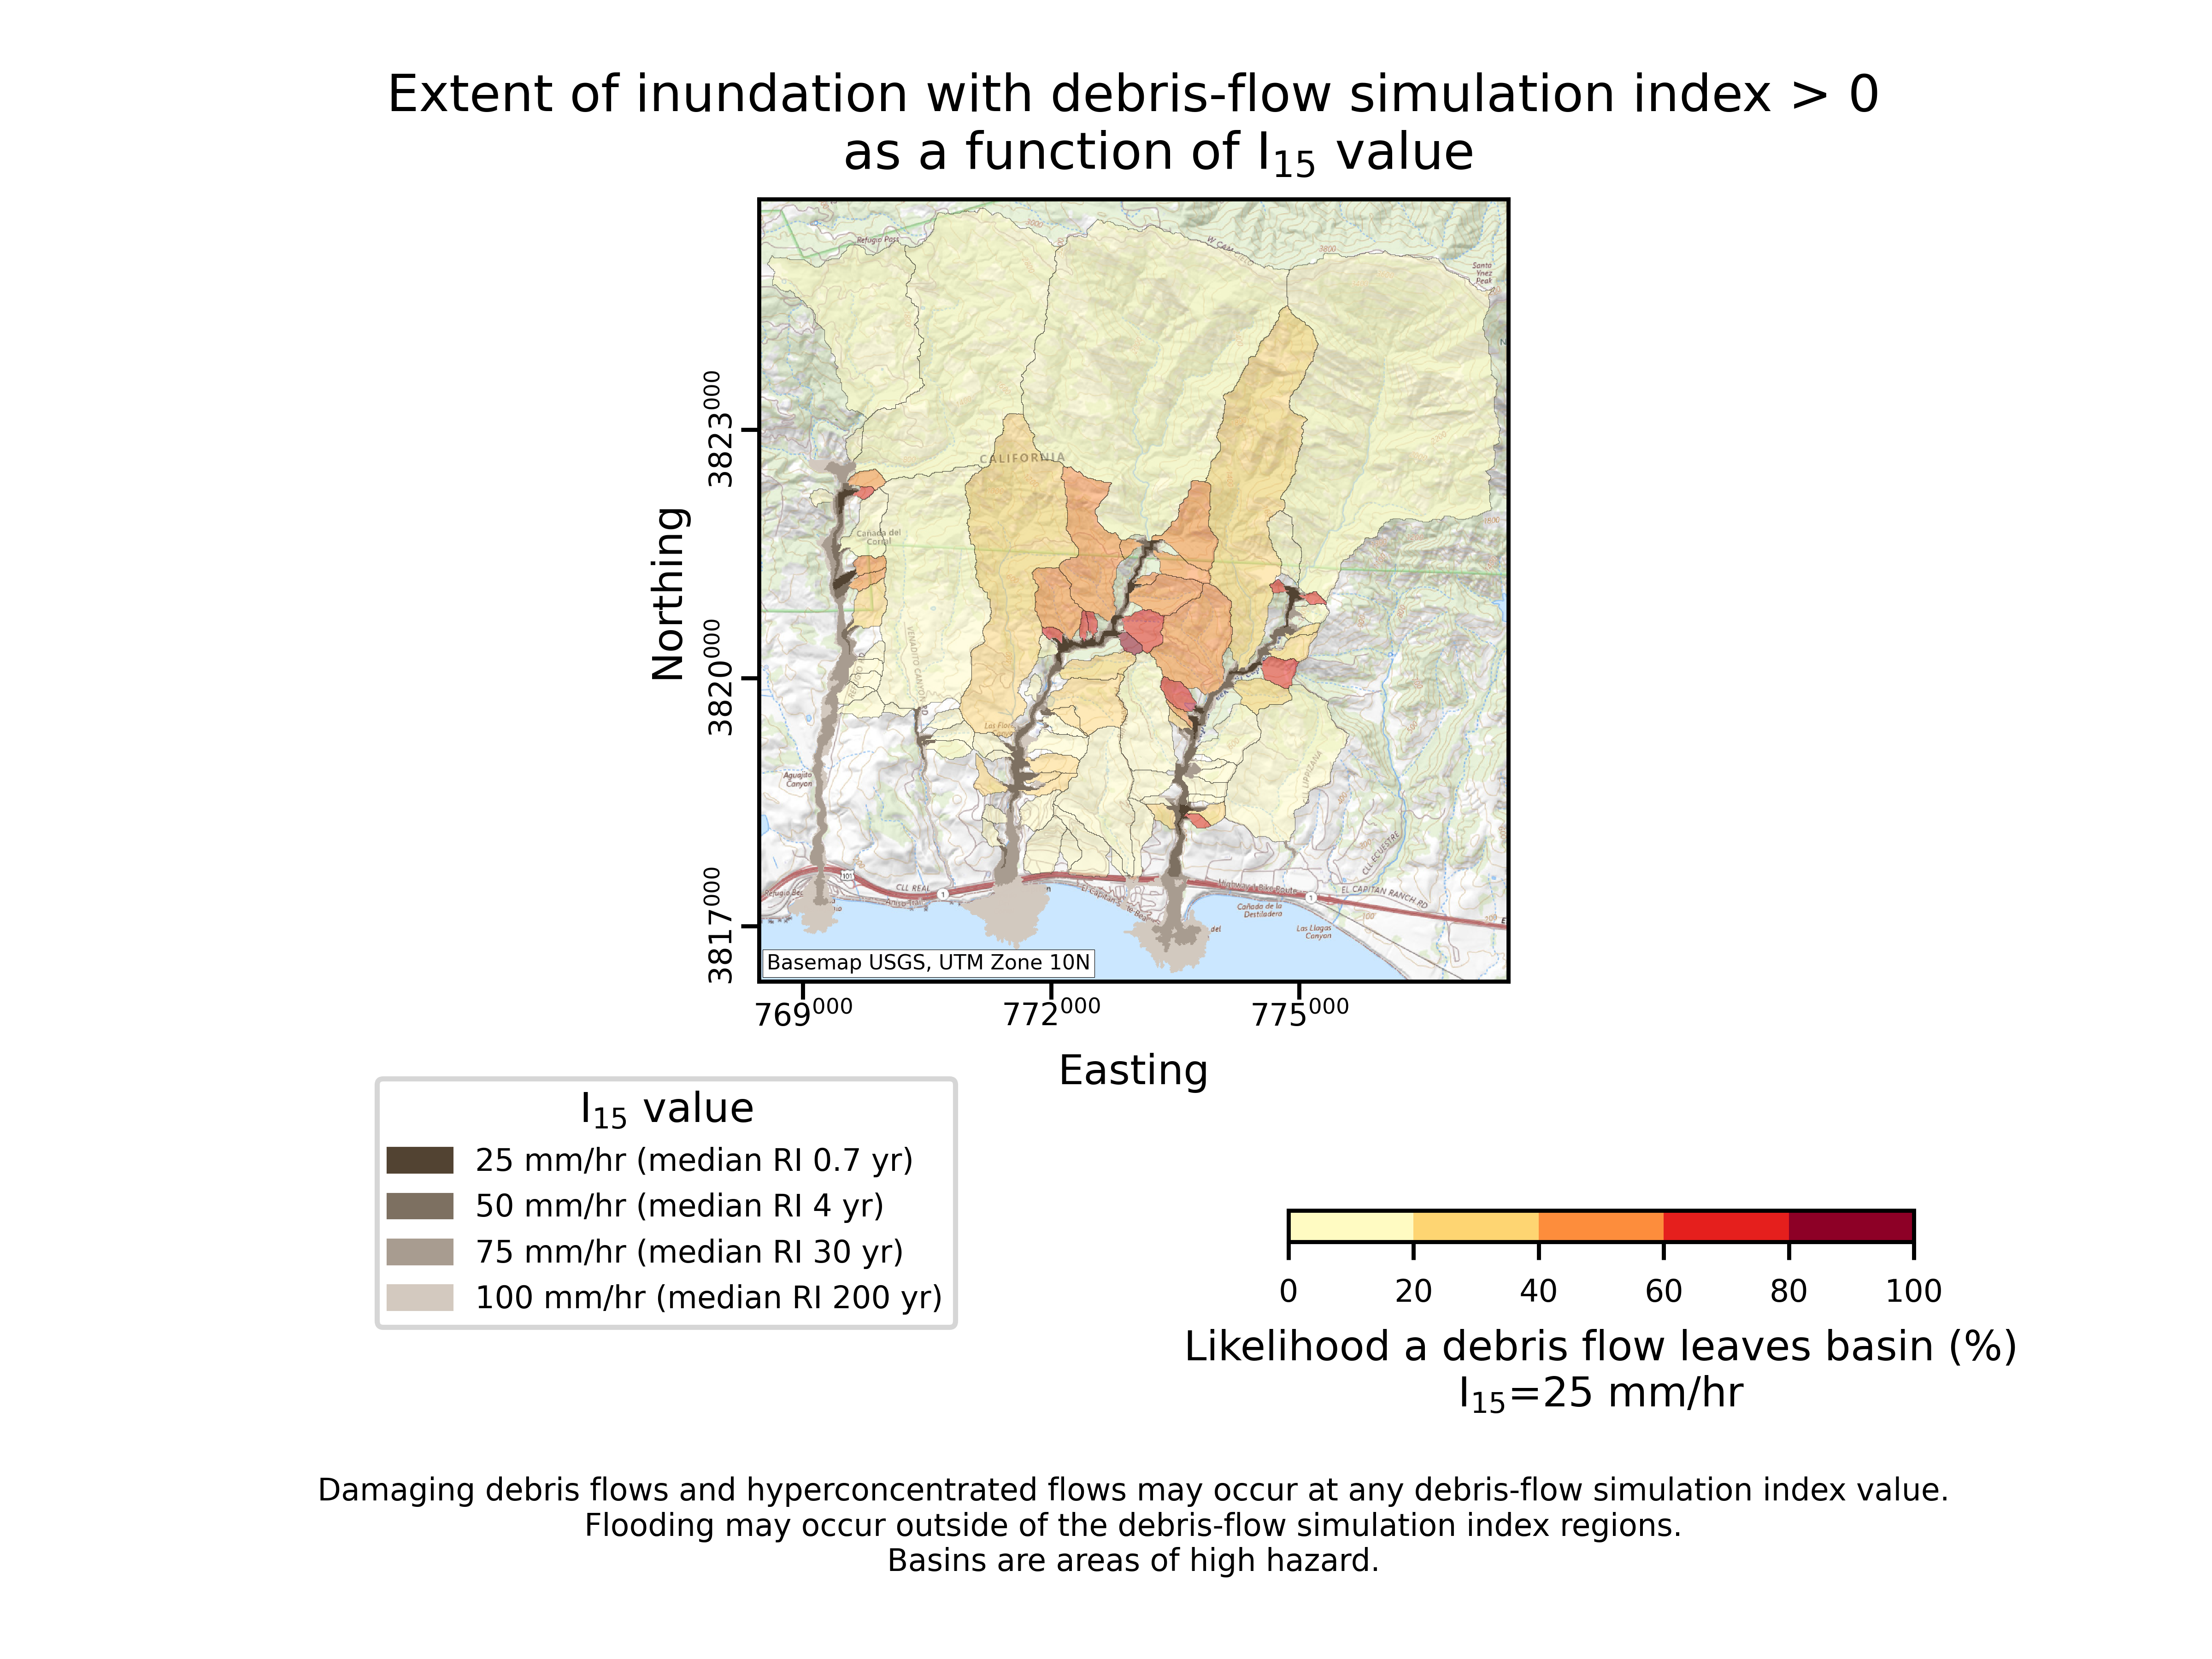
Fig. 6 An example of what a inundation extent plot looks like (based on the 2016 Sherpa Fire).