Example application
For this example we will use the 2016 Sherpa fire. You can choose to initialize the project in any directory, including directories outside of ursa. We will initialize it within ursa/examples.
mkdir examples
cd examples
ursa initialize sherpa
This step will create a directory called sherpa and a number of directories within it. It will download source code used for simulations, and generate a configuration file located at ‘sherpa/config/config.yml’.
You need to edit the config file and move some of files located in ‘ursa/data/shr2016’ into examples/sherpa/user-input.
cd sherpa
cp ../../data/shr2016/shr2016_perimeter.* user-input
cp ../../data/shr2016/shr_dnbr.tif user-input
cp ../../data/shr2016/shr_sev.tif user-input
cp ../../data/shr2016/shr2016_soils.* user-input
Next, edit the config file located at ursa/examples/sherpa/config/config.yml. At a minimum you must edit three blocks. The first block is the fire name.
fire_id: shr2016
The second block is the perimeter
perimeter: user-input/shr2016_perimeter.shp
The third block is about wildcat inputs.
wildcat_inputs:
  dnbr: user-input/shr_dnbr.tif
  severity: user-input/shr_sev.tif
  kf: user-input/shr2016_soils.shp
Optionally, provide an area of interest. If not used, leave blank.
aoi_path: user-input/shr_aoi.shp
To run ursa for the sherpa file, enter the sherpa directory, which contains the folder config, and execute
cd sherpa
ursa run all
This may take a few hours based on on the processing capabilities of your computer. If any of the API servers that ursa relies on are down (e.g., The National Map), the first few steps, which download required data, will not work. However, if there is any break in computation, you should be able to re-run ursa run all and have the computation start from where it left off.
If you run into issues downloading, we suggest that you check the ScienceBase catalog status page.
In addition to all of the files generated by setting up and running simulations, this command will generate a file called snakemake_{date}_{time}.log with a log of the run.
See the User Guide for an explaination of input files and files produced, including generated plots.
The following plot is an example of a standard plot produced by ursa. It depicts the debris-flow simulation index for a single rainfall intensity.
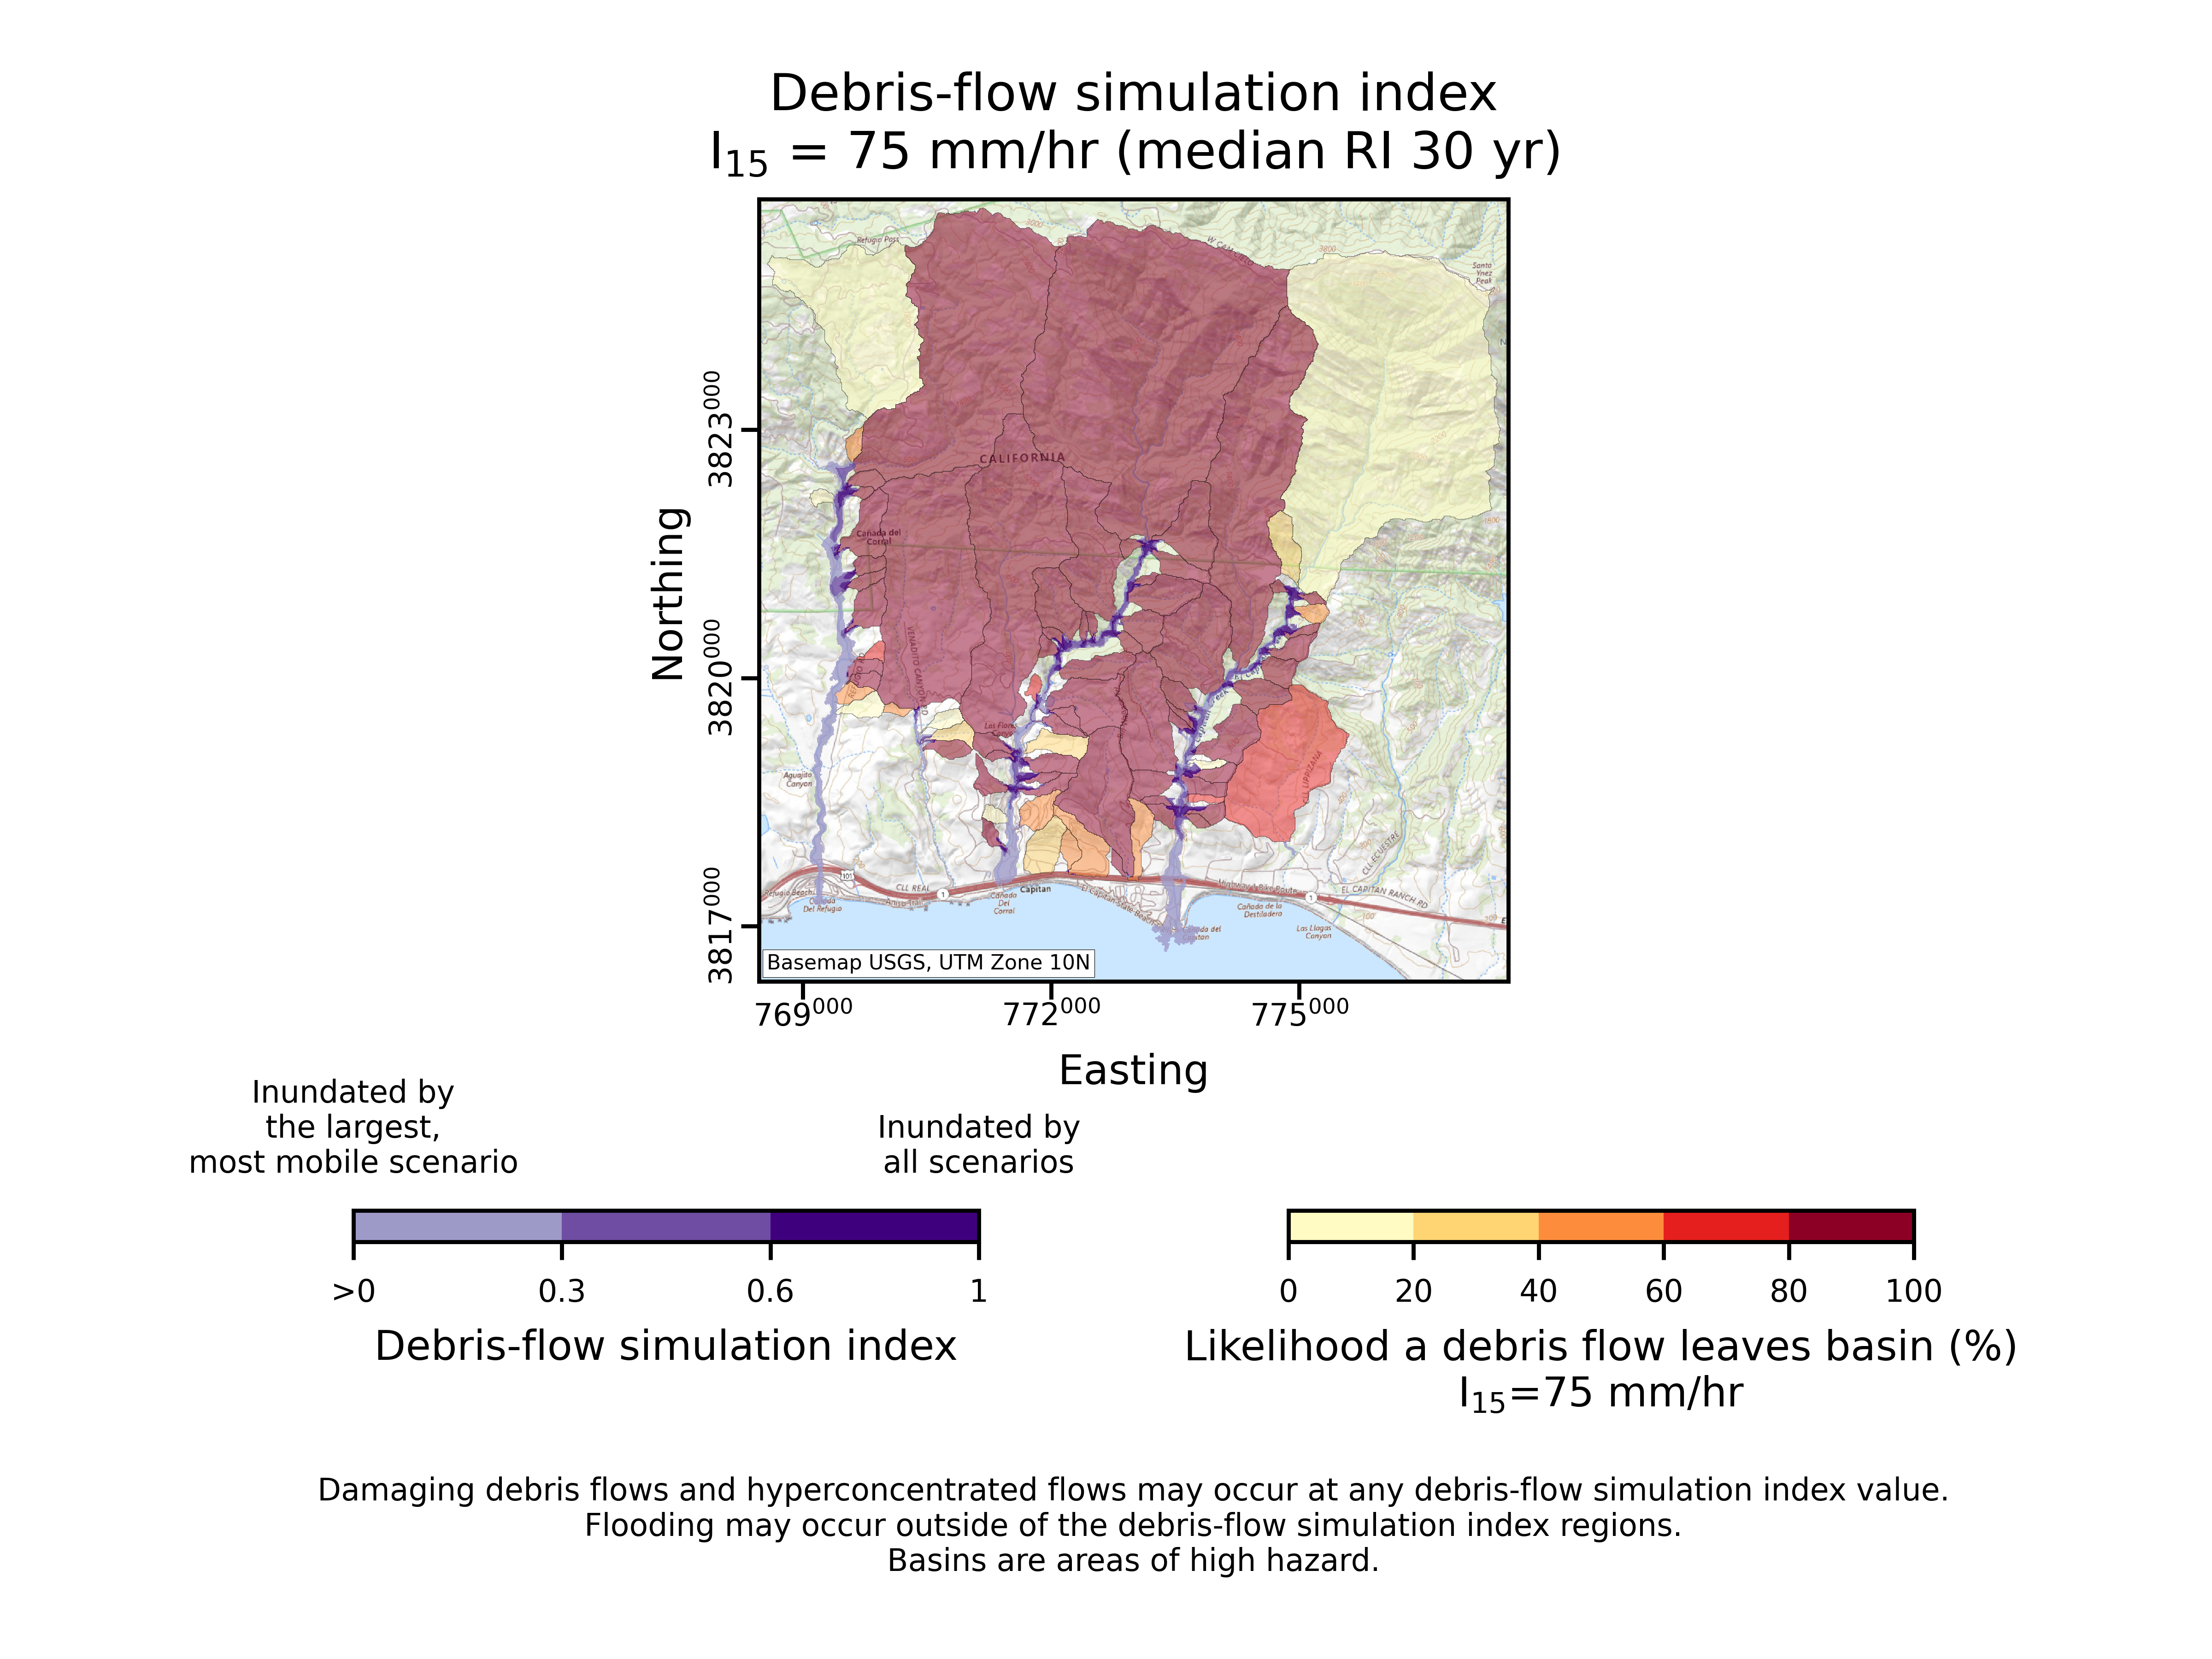
Fig. 9 A debris-flow simulation index plot for the 2016 Sherpa Fire.